Free Access
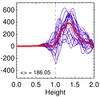
Fig. 4
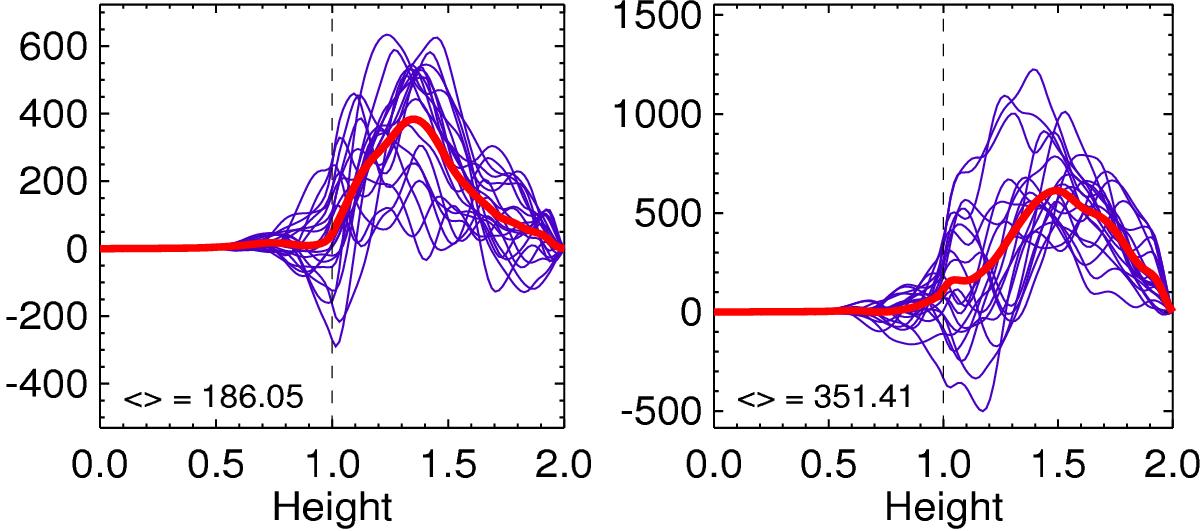
Small-scale current helicity ⟨ b·curl b ⟩ the result of the large-scale current helicity ![]() for
for ![]() ,
, ![]() (left) and
(left) and ![]() ,
, ![]() (right). The numbers in the plots indicate the averages of all given snapshots in z = [ 1,2 ]. The stratified layer is convectively unstable on the right-hand side of the vertical dashed line.
(right). The numbers in the plots indicate the averages of all given snapshots in z = [ 1,2 ]. The stratified layer is convectively unstable on the right-hand side of the vertical dashed line.
This figure is made of several images, please see below:
Current usage metrics show cumulative count of Article Views (full-text article views including HTML views, PDF and ePub downloads, according to the available data) and Abstracts Views on Vision4Press platform.
Data correspond to usage on the plateform after 2015. The current usage metrics is available 48-96 hours after online publication and is updated daily on week days.
Initial download of the metrics may take a while.