Fig. 5
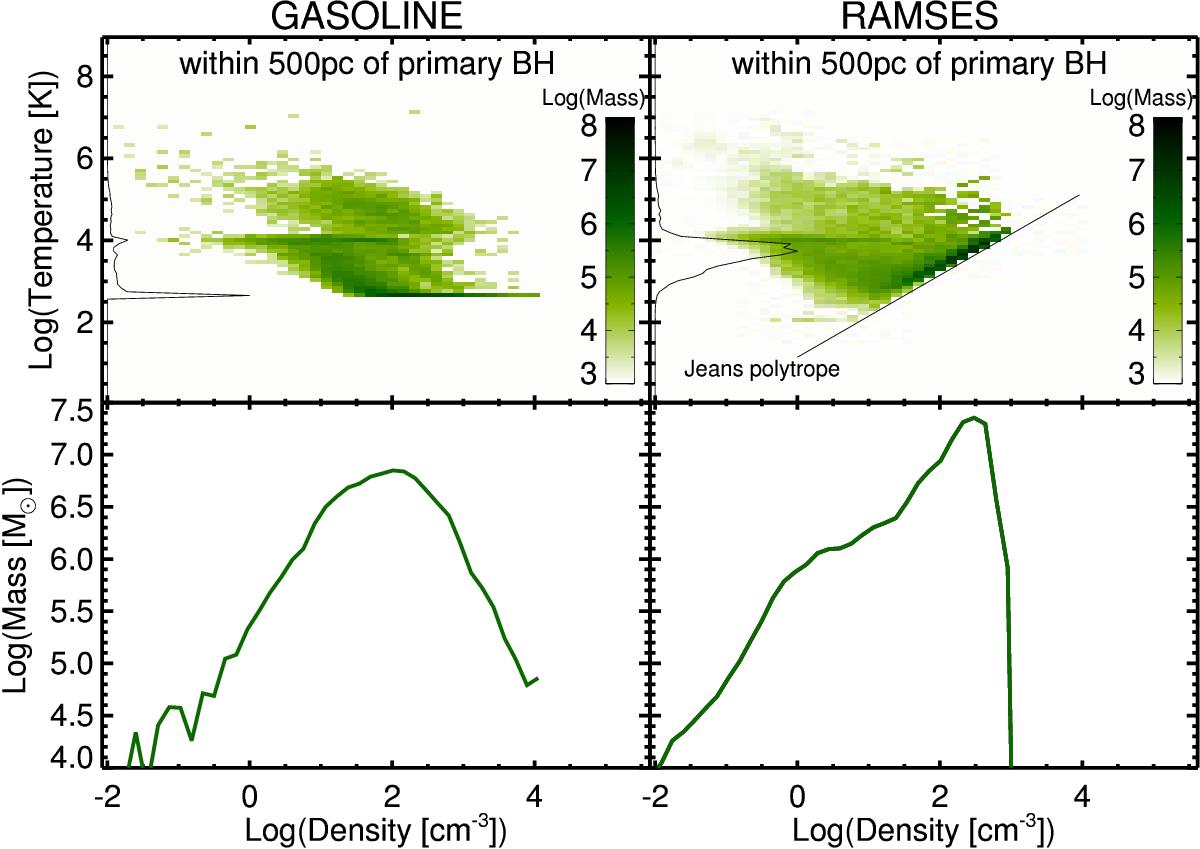
Density-temperature diagrams (top row) and density PDFs (bottom row) for gas in gasoline (left column) and ramses (right column). We show only gas within 500 pc of the primary galactic center in each simulation, and we use a snapshot near the maximum separation (first apocenter, around 500 Myr). In the top panels, we include the temperature distribution along the left axis (arbitrarily normalized and shown on a linear scale). We also schematically show the Jeans polytrope temperature floor for the ramses simulation (straight black line), which keeps the average gas significantly hotter than in gasoline.
Current usage metrics show cumulative count of Article Views (full-text article views including HTML views, PDF and ePub downloads, according to the available data) and Abstracts Views on Vision4Press platform.
Data correspond to usage on the plateform after 2015. The current usage metrics is available 48-96 hours after online publication and is updated daily on week days.
Initial download of the metrics may take a while.