Fig. 2
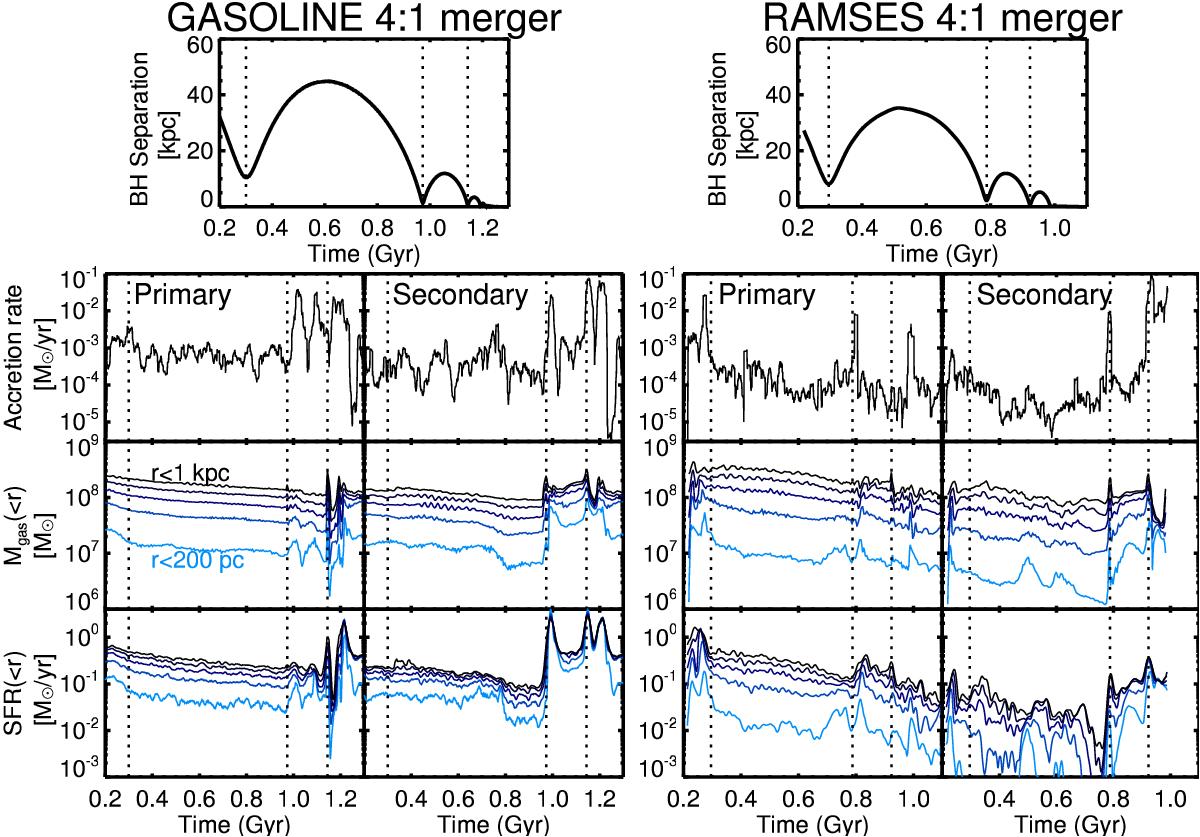
BH separation in kpc (top), black hole accretion rate (BHAR) in M⊙ yr-1 (second row), gas mass in M⊙ within spheres up to 1 kpc in radius (third row), and SFR in M⊙ yr-1 within the same spheres (bottom row) vs. time for a 4:1 merger with gasoline (left) and ramses (right). For each simulation, we show quantities for the primary galaxy/BH on the left, and the secondary galaxy/BH on the right. We show gas masses and SFRs within radii of 200 pc to 1 kpc, in increments of 200 pc. Quantities are smoothed on 10 Myr timescales. Note that time-axes differ by ~20% (see Sect. 3.2.1). Vertical dotted lines mark local minima in the separation between the two black holes in all panels. The gasoline and ramses simulations show qualitatively similar results: enhanced accretion and star formation rates at the second pericenter, and especially at the third pericenter/coalescence.
Current usage metrics show cumulative count of Article Views (full-text article views including HTML views, PDF and ePub downloads, according to the available data) and Abstracts Views on Vision4Press platform.
Data correspond to usage on the plateform after 2015. The current usage metrics is available 48-96 hours after online publication and is updated daily on week days.
Initial download of the metrics may take a while.