Fig. 1
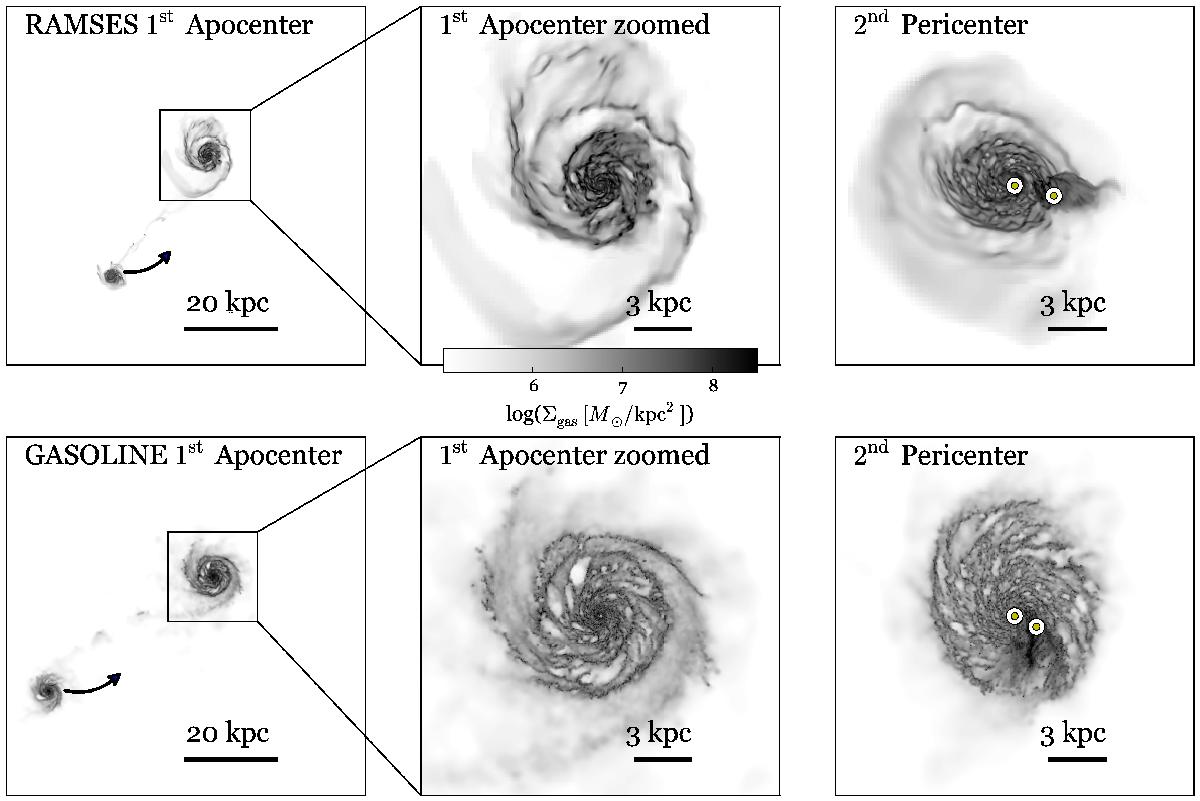
Snapshots showing gas surface density for our 4:1 ramses (top) and gasoline (bottom) simulations. Left panels show both galaxies at first apocenter, with arrows roughly indicating the direction of travel of the secondary galaxy. Middle panels show a zoom-in on the primary galaxy at first apocenter, and right panels show both galaxies at the second pericenter. In the right panels, circles mark the positions of the black holes (in each simulation, the more massive black hole is to the left).
Current usage metrics show cumulative count of Article Views (full-text article views including HTML views, PDF and ePub downloads, according to the available data) and Abstracts Views on Vision4Press platform.
Data correspond to usage on the plateform after 2015. The current usage metrics is available 48-96 hours after online publication and is updated daily on week days.
Initial download of the metrics may take a while.