Fig. 9
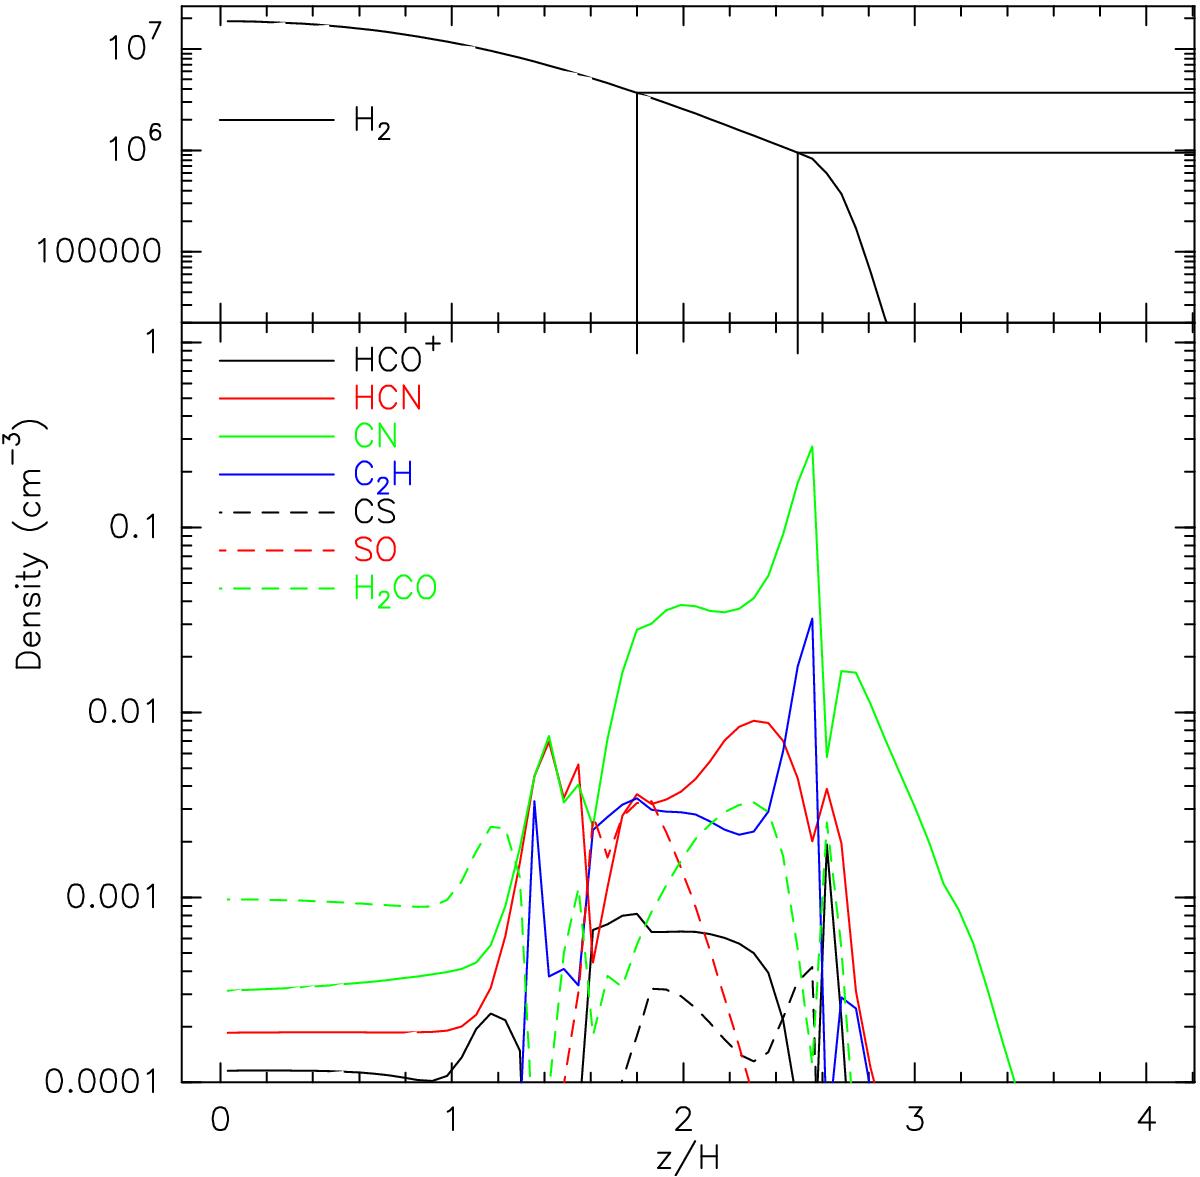
Predicted molecular densities at 300 au as a function of height above the disk midplane (in scale heights, defined as cs/ Ω, where cs is the sound speed, and Ω the Keplerian angular frequency). The upper panel shows the H2 density with the two horizontal and vertical lines delimiting the range where most molecules are abundant.
Current usage metrics show cumulative count of Article Views (full-text article views including HTML views, PDF and ePub downloads, according to the available data) and Abstracts Views on Vision4Press platform.
Data correspond to usage on the plateform after 2015. The current usage metrics is available 48-96 hours after online publication and is updated daily on week days.
Initial download of the metrics may take a while.