Fig. 7
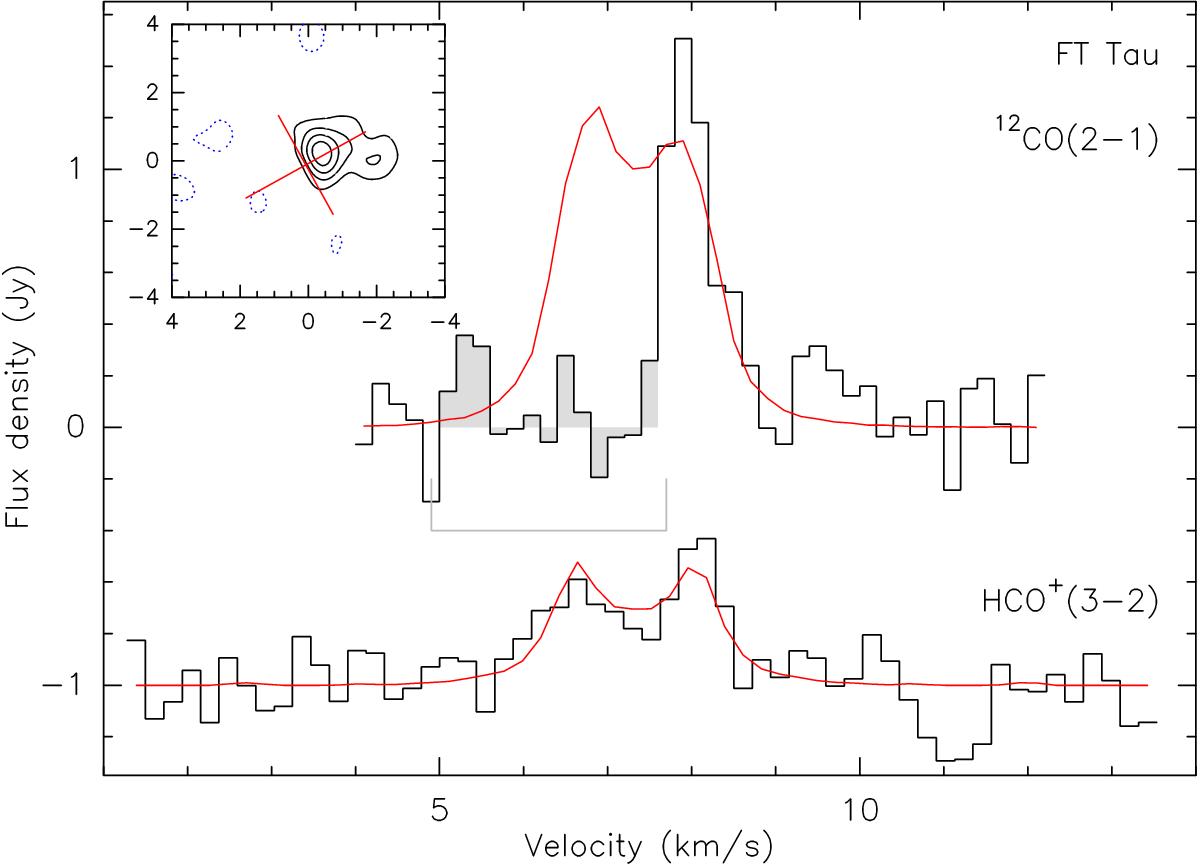
Observed spectra and fitted profiles for FT Tau. The gray area is the range affected by confusion from the molecular cloud that is ignored in the CO analysis. The insert shows the integrated CO emission with contour spacings of 50 mJy km s-1 (angular offsets in arcsec). The cross indicates the position and orientation of the disk (derived from the continuum emission and kinematics pattern).
Current usage metrics show cumulative count of Article Views (full-text article views including HTML views, PDF and ePub downloads, according to the available data) and Abstracts Views on Vision4Press platform.
Data correspond to usage on the plateform after 2015. The current usage metrics is available 48-96 hours after online publication and is updated daily on week days.
Initial download of the metrics may take a while.