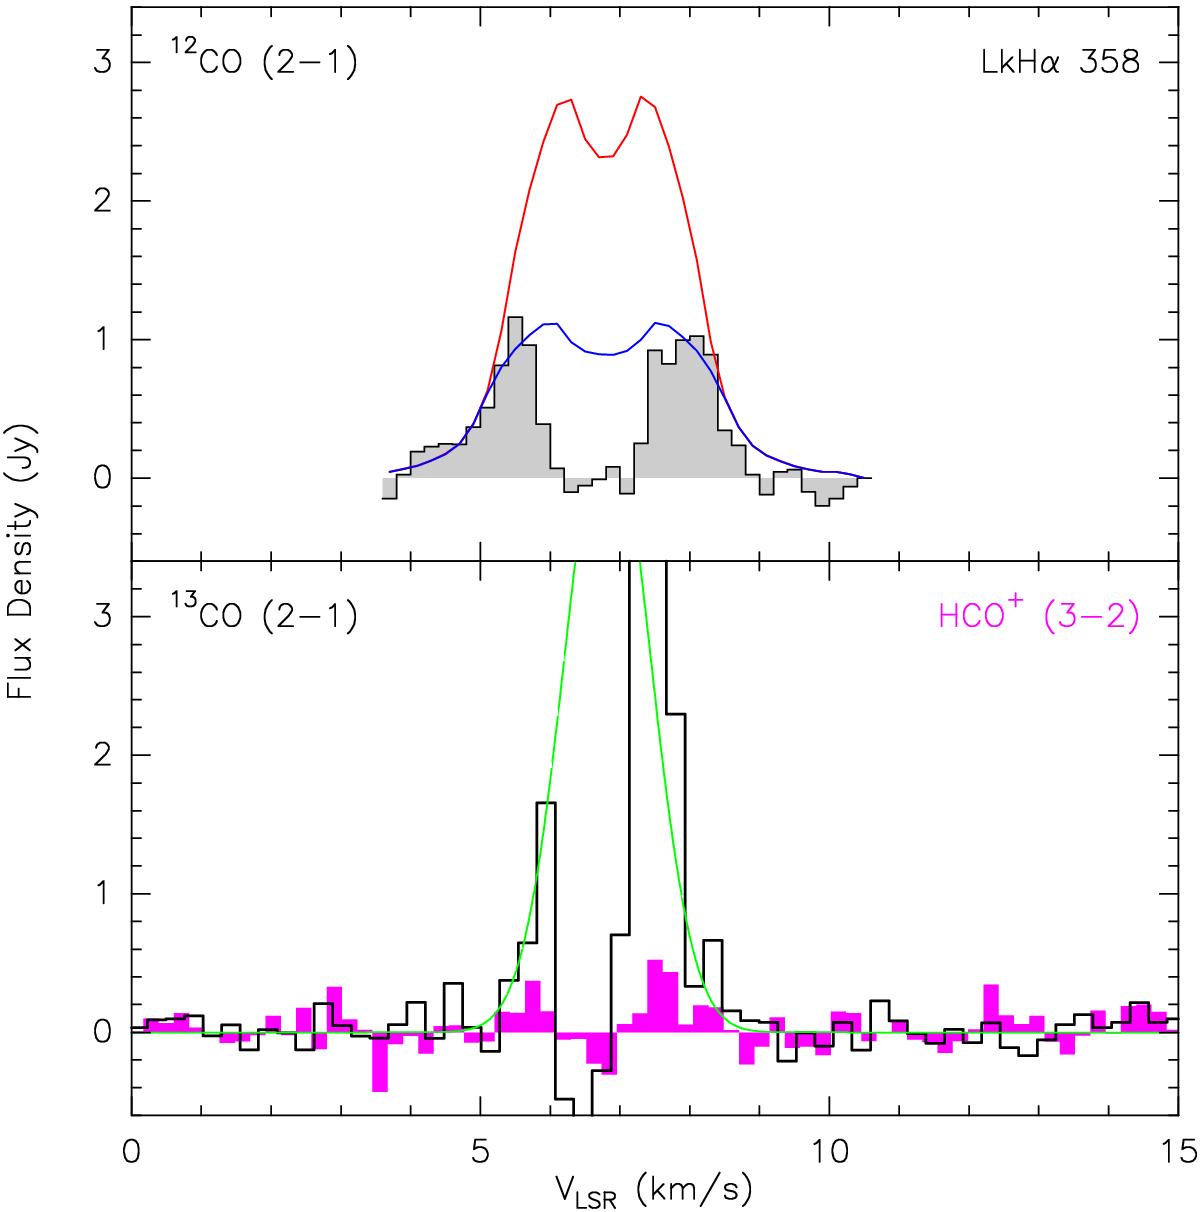
Fig. 6

Spectra of 12CO, 13CO, and HCO+ toward LkHα 358. Top: 12CO from the interferometric measurement of Schaefer et al. (2009). The blue curve is the fitted profile based on the disk analysis made in the uv plane. The red curve uses the same disk parameters, except for the outer radius which is 250 au instead of 170 au. Bottom: 13CO(2−1) spectrum (histogram) and HCO+(3−2) (filled histogram). The green curve is the tentative fit of a disk component from Guilloteau et al. (2013).
Current usage metrics show cumulative count of Article Views (full-text article views including HTML views, PDF and ePub downloads, according to the available data) and Abstracts Views on Vision4Press platform.
Data correspond to usage on the plateform after 2015. The current usage metrics is available 48-96 hours after online publication and is updated daily on week days.
Initial download of the metrics may take a while.


