Free Access
Fig. 5
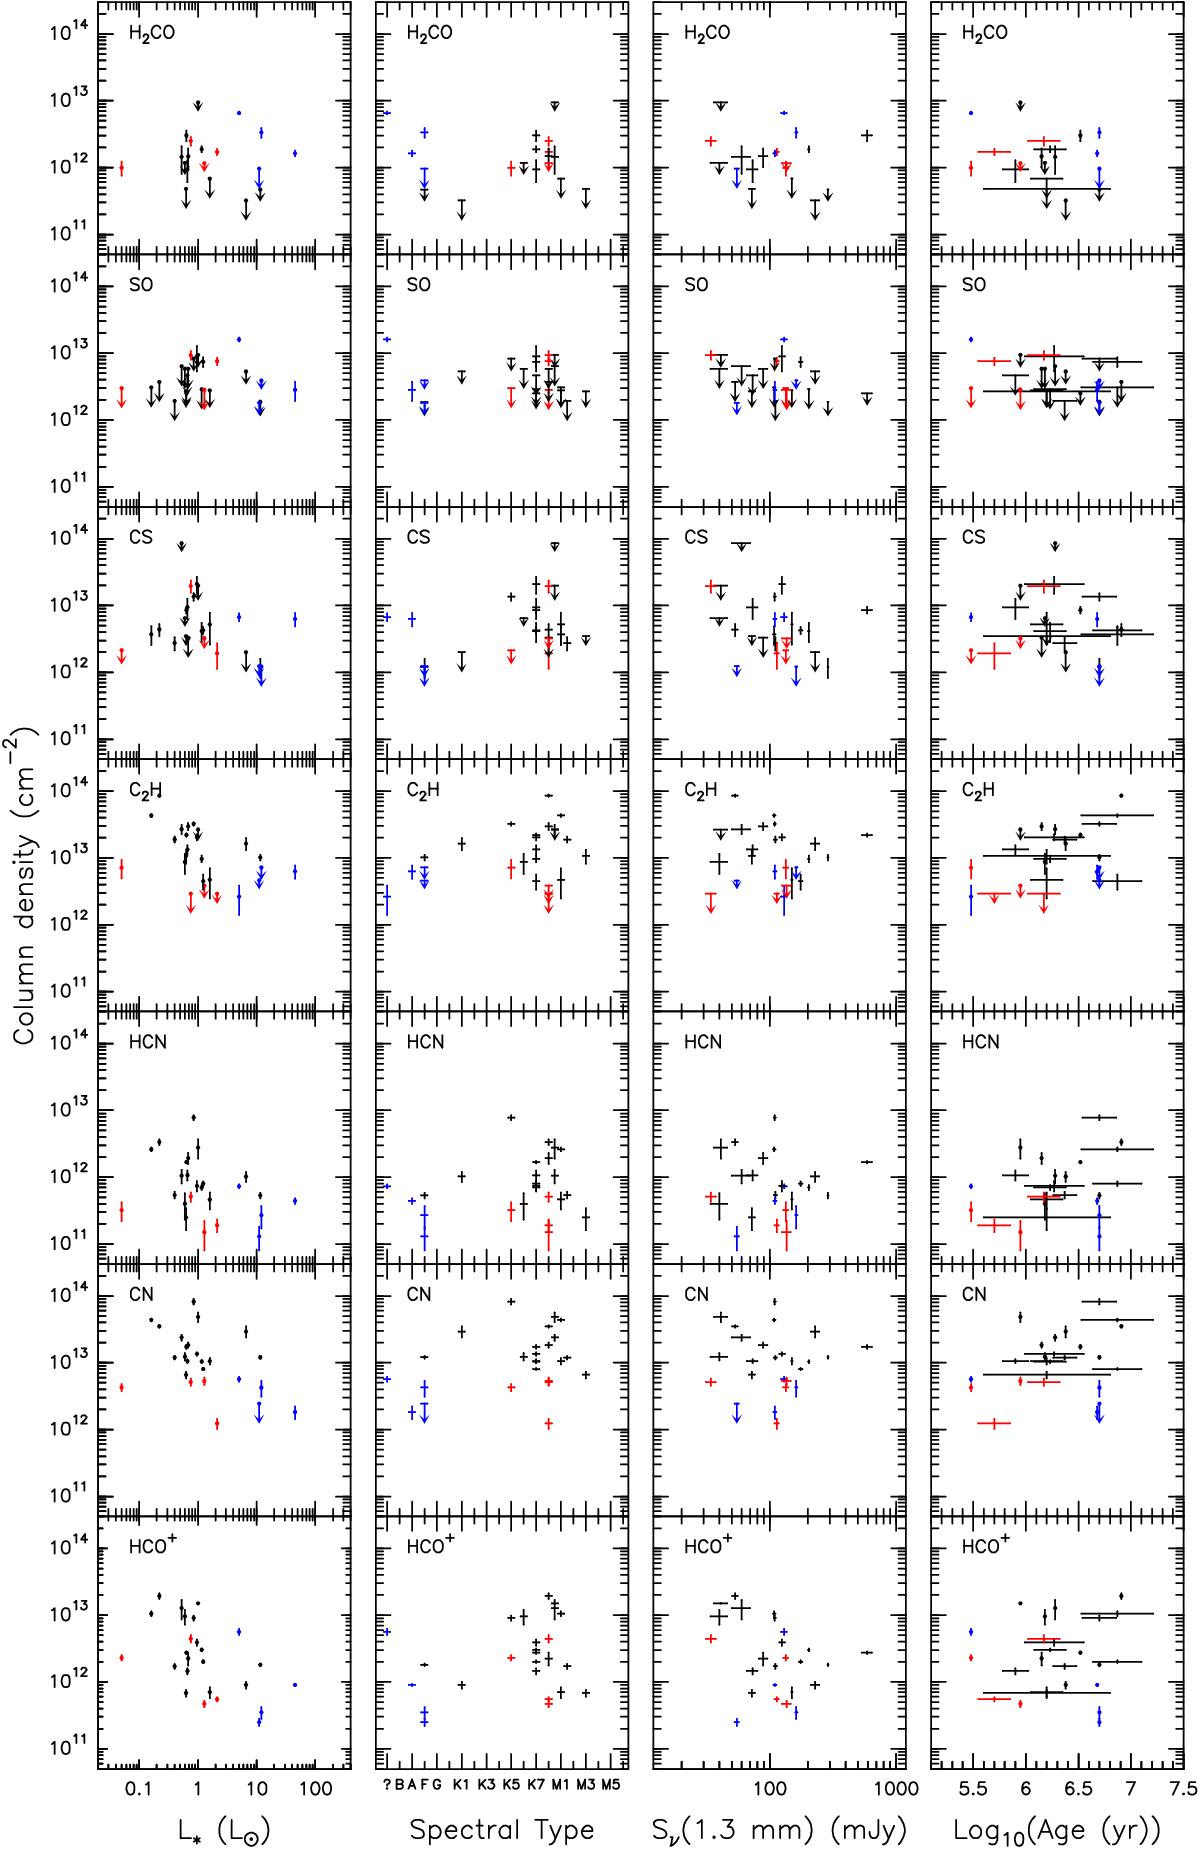
Correlation plot of the column density of molecules at 300 au with stellar luminosity, spectral type, 1.3 mm flux density and stellar age. Embedded objects appear in red, HAe stars in blue, and T Tauri stars in black. Error bars are ± 1σ with limits at 2σ indicated by arrows.
Current usage metrics show cumulative count of Article Views (full-text article views including HTML views, PDF and ePub downloads, according to the available data) and Abstracts Views on Vision4Press platform.
Data correspond to usage on the plateform after 2015. The current usage metrics is available 48-96 hours after online publication and is updated daily on week days.
Initial download of the metrics may take a while.