Fig. 1
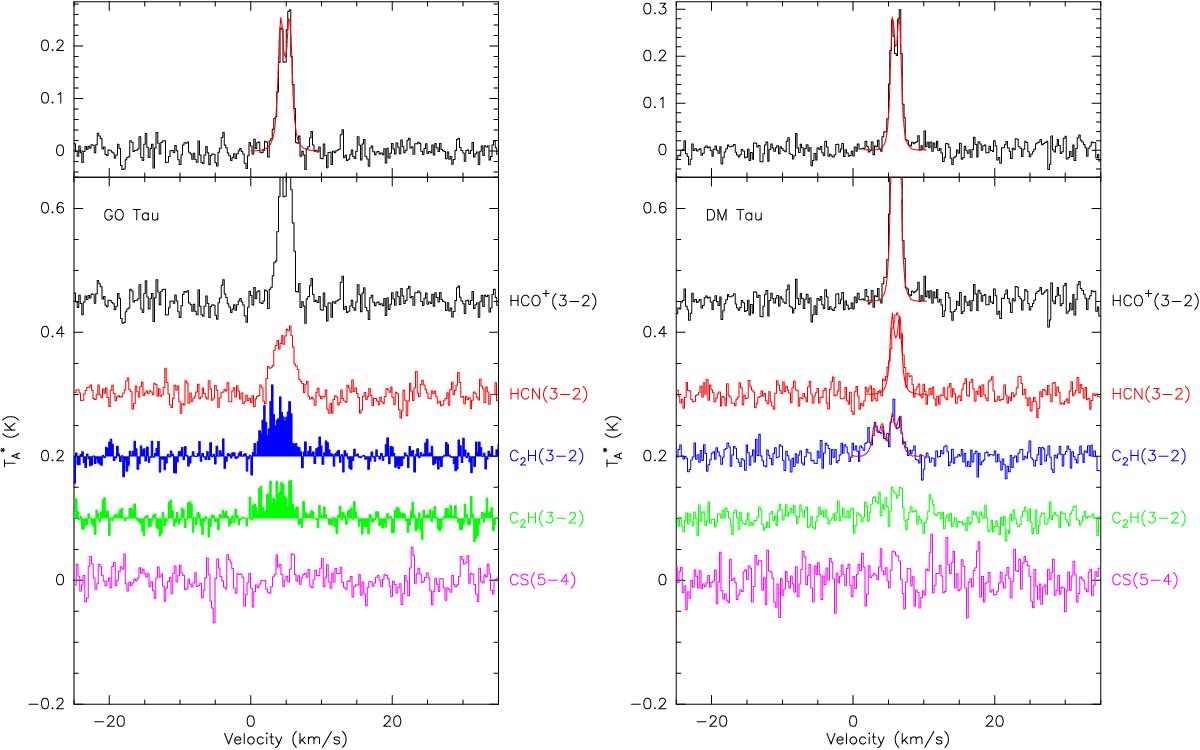
Spectra of the observed transitions toward GO Tau and DM Tau. Intensity scale is ![]() ; conversion to flux density can be made by multiplying by 9 Jy/K. The thin red lines are the synthetic profiles obtained through the complete disk modeling (Sect. 4.5). The two groups of two hyperfine components for C2H are presented in separate spectra: J = 7/2−5/2 in blue, J = 5/2−3/2 in green. The upper panels present, with a different intensity scale, the HCO+J = 3−2 spectra with the best-fit model superimposed.
; conversion to flux density can be made by multiplying by 9 Jy/K. The thin red lines are the synthetic profiles obtained through the complete disk modeling (Sect. 4.5). The two groups of two hyperfine components for C2H are presented in separate spectra: J = 7/2−5/2 in blue, J = 5/2−3/2 in green. The upper panels present, with a different intensity scale, the HCO+J = 3−2 spectra with the best-fit model superimposed.
Current usage metrics show cumulative count of Article Views (full-text article views including HTML views, PDF and ePub downloads, according to the available data) and Abstracts Views on Vision4Press platform.
Data correspond to usage on the plateform after 2015. The current usage metrics is available 48-96 hours after online publication and is updated daily on week days.
Initial download of the metrics may take a while.