Fig. 6
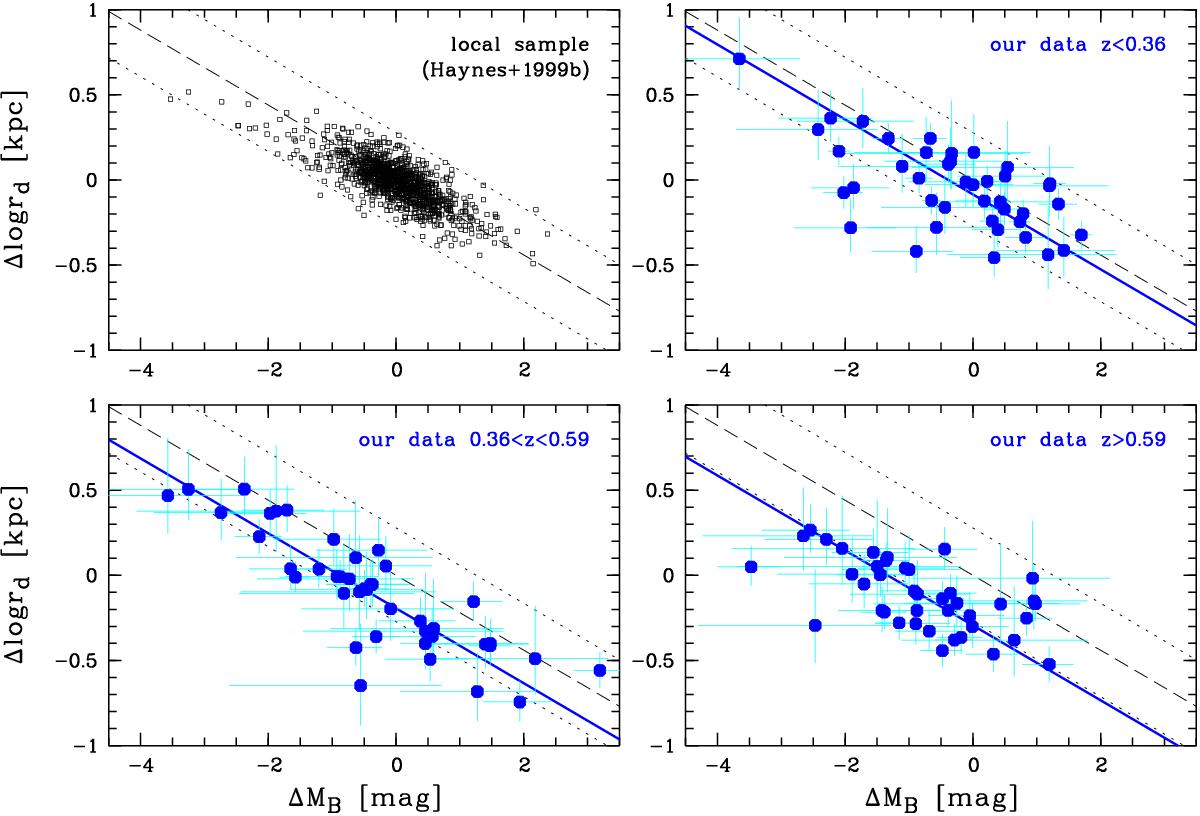
Combined look at the offsets ΔMB from the Tully-Fisher relation and the offsets Δlog rd from the velocity-size relation. Top left: local sample from Haynes et al. (1999b; no error bars shown for clarity), showing a correlation between the two parameters (the dashed and dotted lines show the fit and 3σ scatter). Top right, bottom left and bottom right: distribution of our data in three redshift bins comprising 41−42 galaxies each, with a fixed-slope fit indicated by a solid line. The local fit and 3σ scatter are displayed for comparison in each panel. These figures show the combined evolution in luminosity and size toward higher redshifts. See text for details.
Current usage metrics show cumulative count of Article Views (full-text article views including HTML views, PDF and ePub downloads, according to the available data) and Abstracts Views on Vision4Press platform.
Data correspond to usage on the plateform after 2015. The current usage metrics is available 48-96 hours after online publication and is updated daily on week days.
Initial download of the metrics may take a while.