Fig. 5
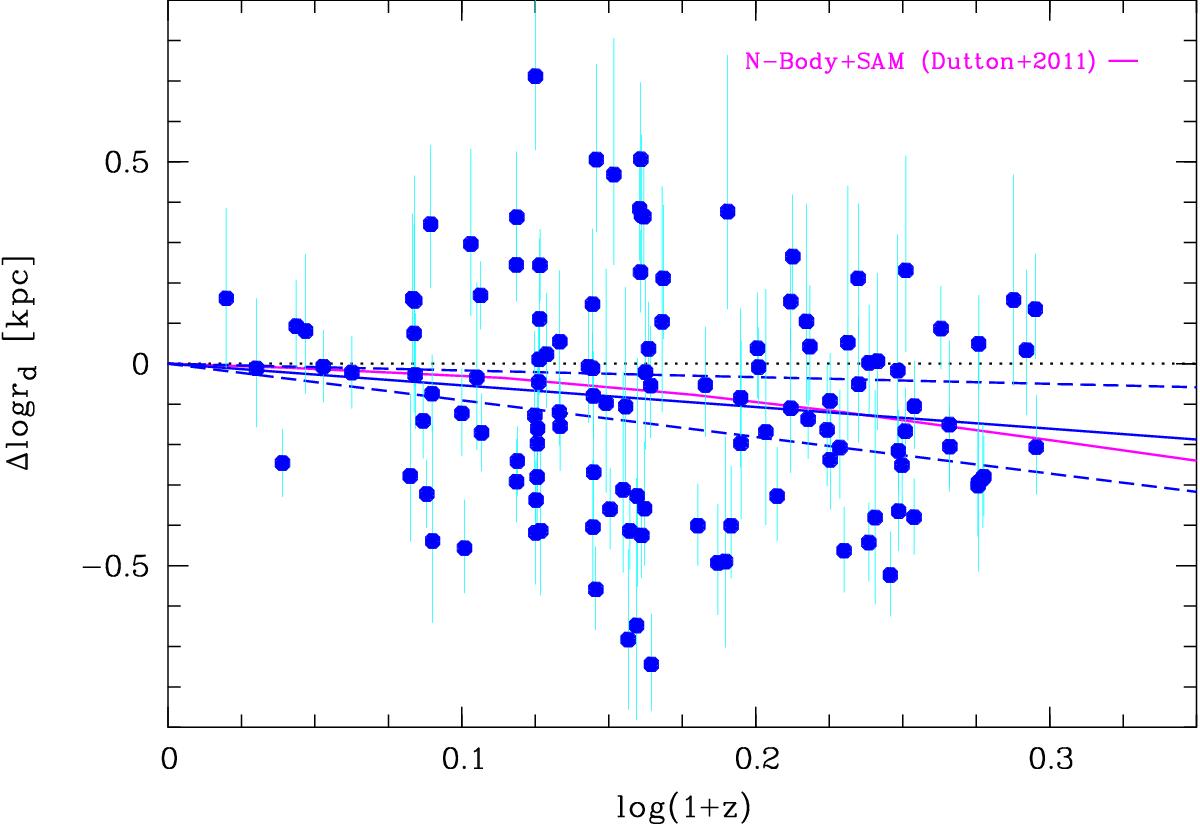
Offsets Δlog rd of our galaxy sample from the local velocity-size relation (see Fig. 4) as a function of redshift. Negative values in Δlog rd correspond to smaller sizes at given maximum rotation velocity Vmax. We find successively smaller disks toward higher redshifts. A linear fit to our data (displayed as a blue solid line, and dashed lines indicate the 1σ error range) shows that disk galaxies at z = 1 were smaller than their local counterparts by a factor of ~1.5. For comparison, the solid magenta line shows predictions from simulations by Dutton et al. (2011). The dotted line illustrates no evolution in size.
Current usage metrics show cumulative count of Article Views (full-text article views including HTML views, PDF and ePub downloads, according to the available data) and Abstracts Views on Vision4Press platform.
Data correspond to usage on the plateform after 2015. The current usage metrics is available 48-96 hours after online publication and is updated daily on week days.
Initial download of the metrics may take a while.