Fig. 4
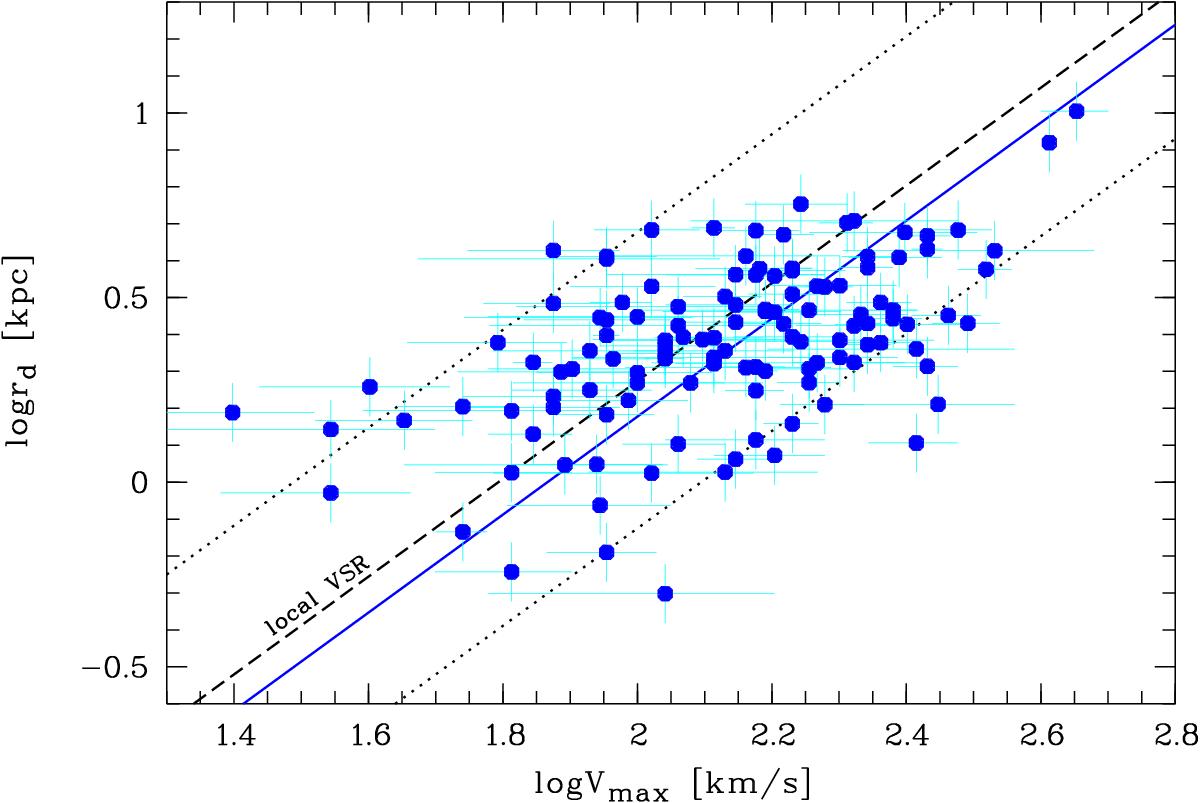
Velocity-size relation (VSR): disk scale length rd as a function of maximum rotation velocity Vmax. We show a comparison between our ⟨ z ⟩ ≈ 0.5 data (circles) and the local VSR as found with data from Haynes et al. (1999b; the black dashed line indicates the fit to the local data (not shown in this figure) and the dotted lines depict the 3σ scatter). The blue solid line shows the fit to the distant sample, which is offset to smaller disk sizes by ⟨ Δlog rd ⟩ = −0.10 ± 0.05 dex.
Current usage metrics show cumulative count of Article Views (full-text article views including HTML views, PDF and ePub downloads, according to the available data) and Abstracts Views on Vision4Press platform.
Data correspond to usage on the plateform after 2015. The current usage metrics is available 48-96 hours after online publication and is updated daily on week days.
Initial download of the metrics may take a while.