Fig. 2
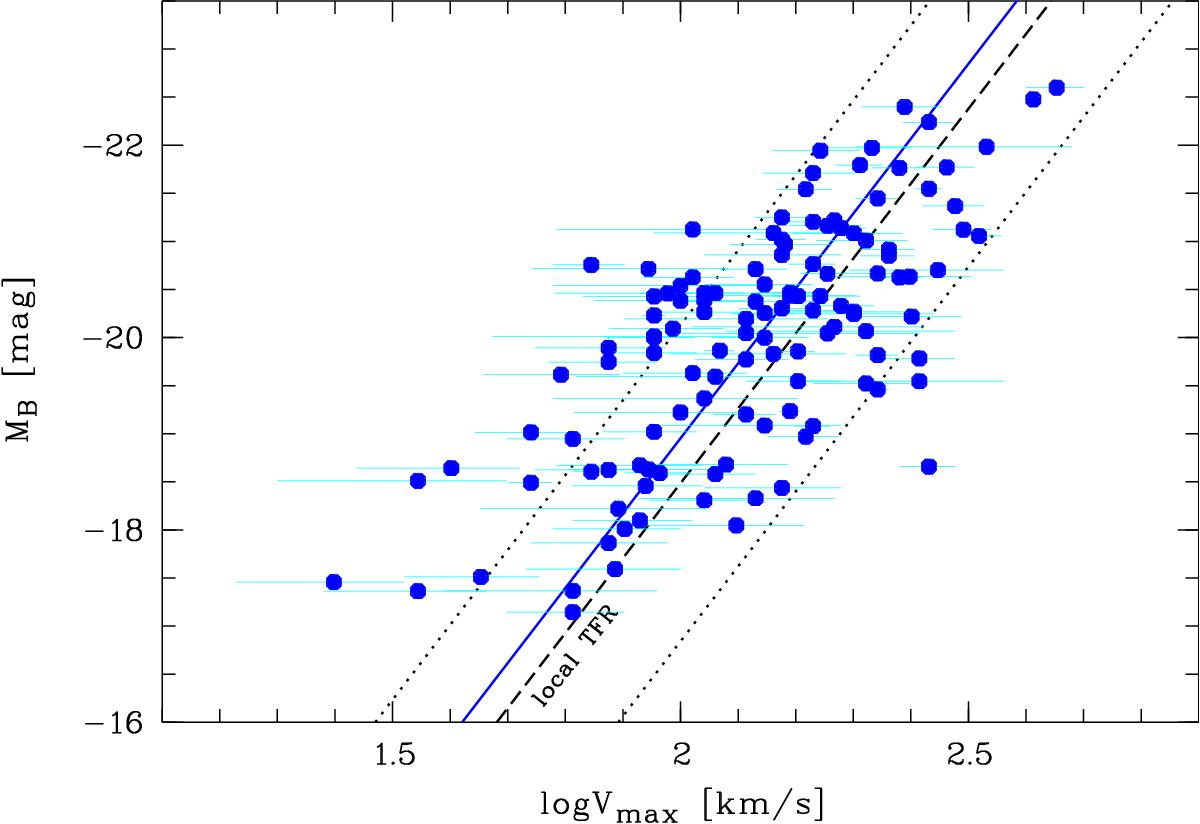
Rest-frame B-band Tully-Fisher diagram, showing a comparison between our sample of 124 disk galaxies at a median redshift ⟨ z ⟩ ≈ 0.5 (solid symbols) and the local Tully-Fisher relation as given by Tully et al. (1998; the black dashed line indicates the fit to the local data (not shown in this figure); the dotted lines give the local 3σ scatter). The blue solid line shows the fit to the distant sample (with the slope fixed to the local value), which is offset from the local Tully-Fisher relation toward higher luminosities by ⟨ ΔMB ⟩ = −0.47 ± 0.16 mag.
Current usage metrics show cumulative count of Article Views (full-text article views including HTML views, PDF and ePub downloads, according to the available data) and Abstracts Views on Vision4Press platform.
Data correspond to usage on the plateform after 2015. The current usage metrics is available 48-96 hours after online publication and is updated daily on week days.
Initial download of the metrics may take a while.