Fig. 4
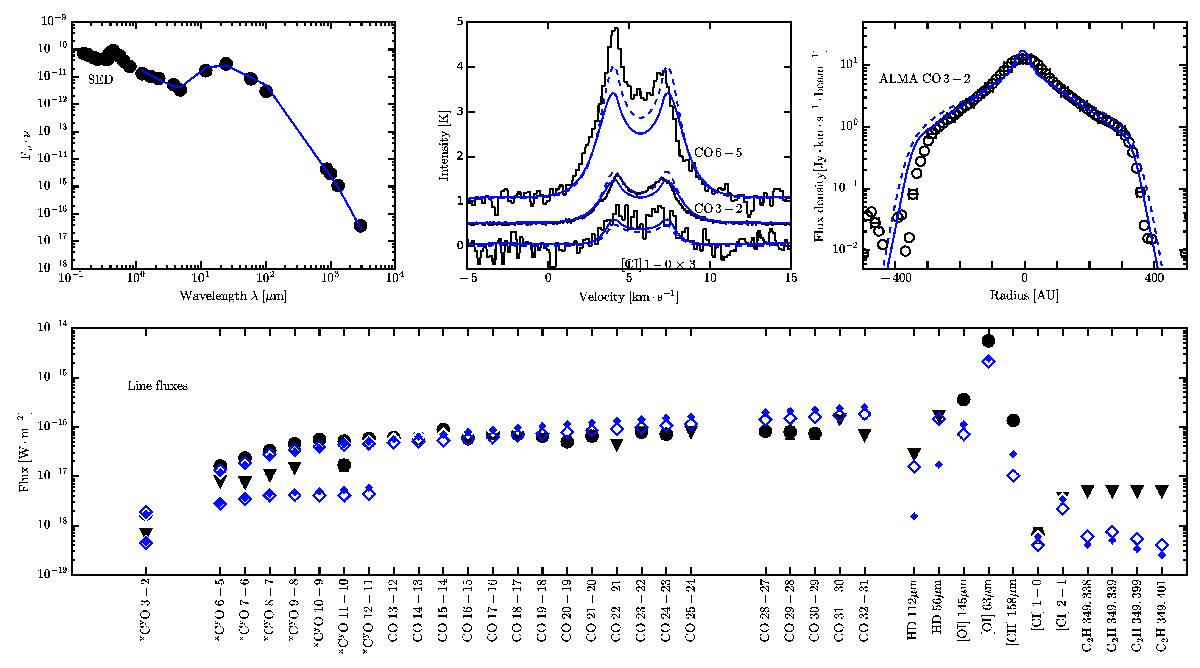
Observations and modelling of HD 100546. The panels show, from top left to bottom, the spectral energy distribution; spectrally resolved line profiles; spatially resolved integrated CO 3–2 emission; and the full set of line fluxes used in the analysis. CO isotopolog lines for a given rotational transition are plotted at the same x-axis location. Two well-fitting models, with a gas to dust ratio Δgas / dust = 10 and [C]/[H]gas = 10-4 (solid blue) and Δgas / dust = 100 and [C]/[H]gas = 10-5 (dashed/open blue) are plotted on the observations (black) to illustrate the range of allowed parameters. The data and model values for C2H have been multiplied by a factor of 103 for display purposes.
Current usage metrics show cumulative count of Article Views (full-text article views including HTML views, PDF and ePub downloads, according to the available data) and Abstracts Views on Vision4Press platform.
Data correspond to usage on the plateform after 2015. The current usage metrics is available 48-96 hours after online publication and is updated daily on week days.
Initial download of the metrics may take a while.