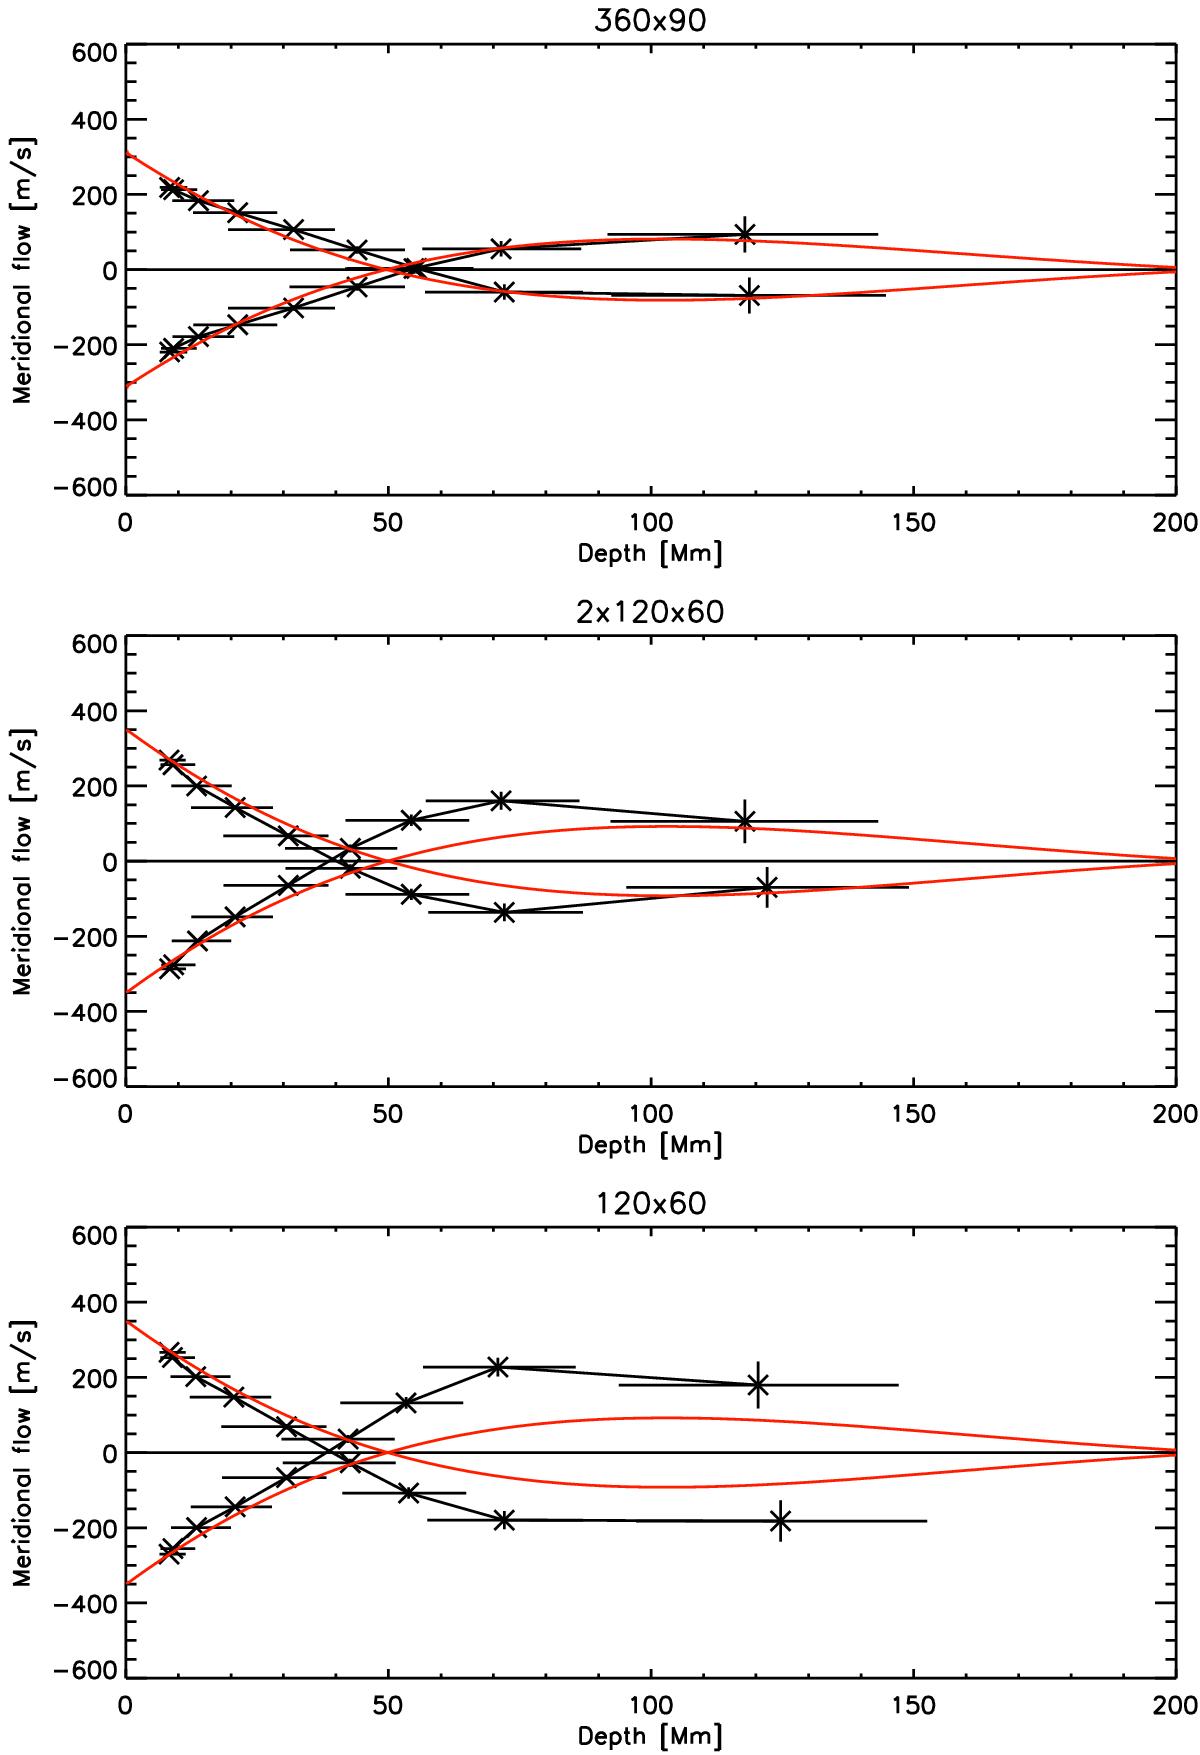
Fig. 1

Inversion results for the three observational setups. First row: meridional flow measurements with both hemispheres of the Sun being observed. Second row: same as top, but with two patches for each hemisphere observed on the front and on the farside of the Sun. Third row: same as top but with observations of two patches, one on the northern, the other on the southern hemisphere. The red lines indicate the averaged flow amplitudes below the observed patches on the northern and southern hemispheres, as taken from the input model. Horizontal error bars represent the quantile width of the averaging kernels.
Current usage metrics show cumulative count of Article Views (full-text article views including HTML views, PDF and ePub downloads, according to the available data) and Abstracts Views on Vision4Press platform.
Data correspond to usage on the plateform after 2015. The current usage metrics is available 48-96 hours after online publication and is updated daily on week days.
Initial download of the metrics may take a while.


