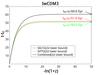
Fig. 7
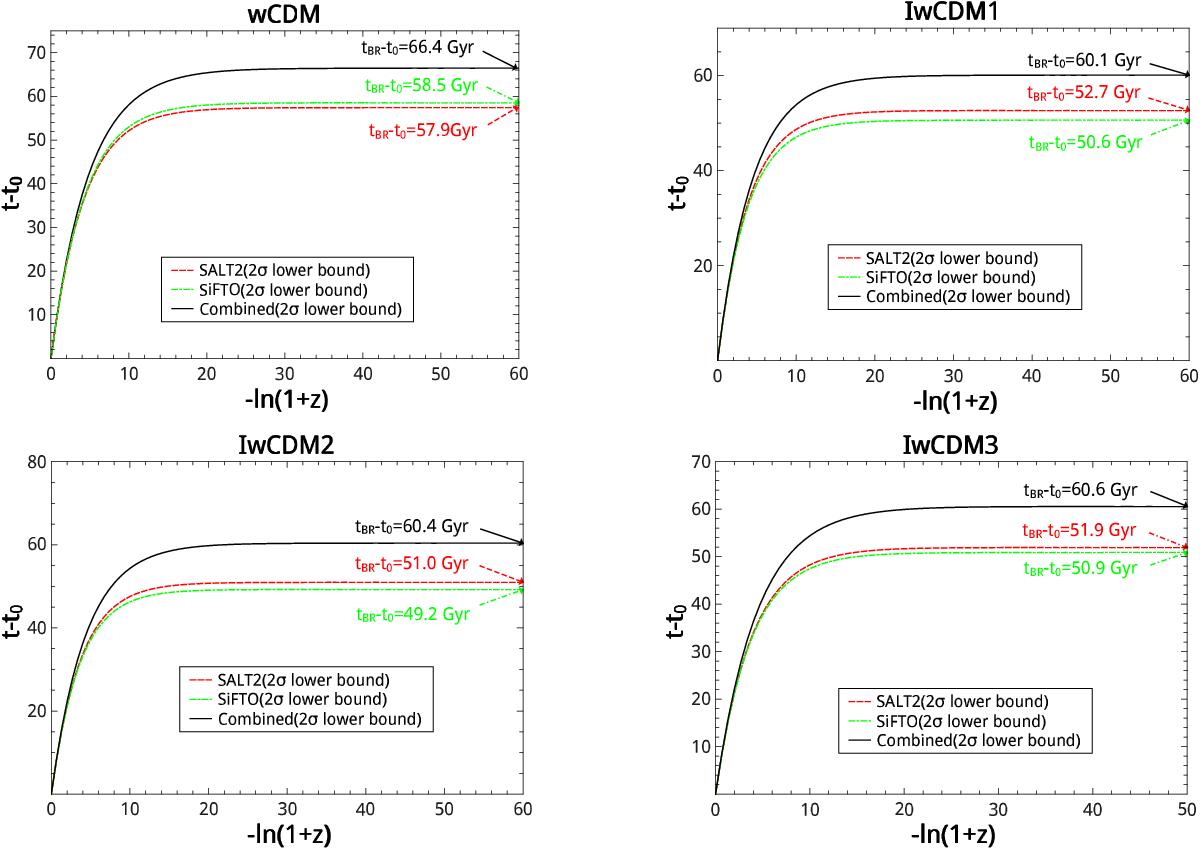
The 2σ lower limits of the time interval t−t0 between a future moment and today, for the wCDM (upper left panel), the IwCDM1 (upper right panel), the IwCDM2 (lower left panel) and the IwCDM3 (lower right panel) model. combined (black solid lines), SALT2 (red dashed lines), and SiFTO (green dash-dotted lines) denote the results given by the SN(combined)+CMB+GC, the SN(SALT2)+CMB+GC, and the SN(SiFTO)+CMB+GC data, respectively. The 2σ lower bound values of tBR−t0 given by the three SNLS3 data are also listed on this figure.
Current usage metrics show cumulative count of Article Views (full-text article views including HTML views, PDF and ePub downloads, according to the available data) and Abstracts Views on Vision4Press platform.
Data correspond to usage on the plateform after 2015. The current usage metrics is available 48-96 hours after online publication and is updated daily on week days.
Initial download of the metrics may take a while.