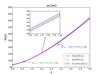
Fig. 2
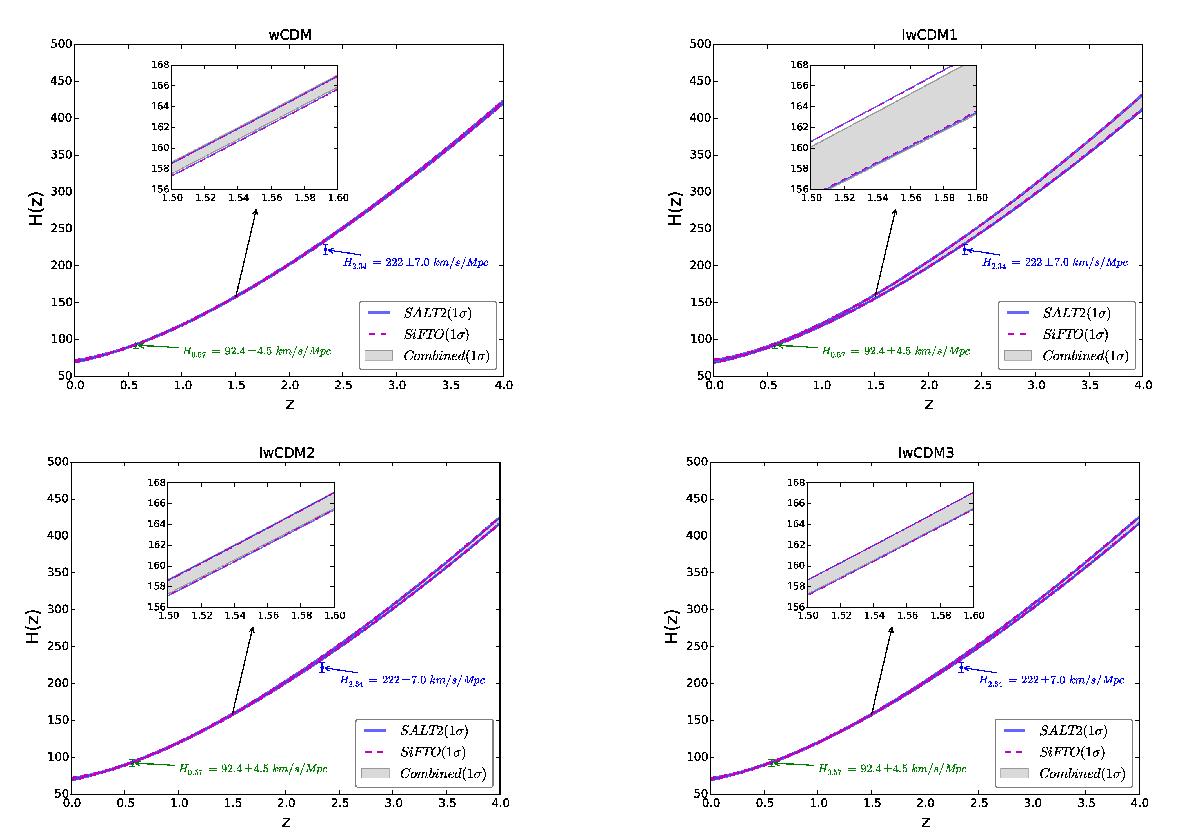
The 1σ confidence regions of Hubble parameter H(z) at redshift region [0,4], for the wCDM (upper left panel), the IwCDM1 (upper right panel), the IwCDM2 (lower left panel), and the IwCDM3 (lower right panel) model, where the data points of H0.57 and H2.34 are also marked by diamonds with error bars for comparison. combined (gray filled regions), SALT2 (blue solid lines), and SiFTO (purple dashed lines) denote the results given by the SN(combined)+CMB+GC, the SN(SALT2)+CMB+GC, and the SN(SiFTO)+CMB+GC data, respectively.
Current usage metrics show cumulative count of Article Views (full-text article views including HTML views, PDF and ePub downloads, according to the available data) and Abstracts Views on Vision4Press platform.
Data correspond to usage on the plateform after 2015. The current usage metrics is available 48-96 hours after online publication and is updated daily on week days.
Initial download of the metrics may take a while.