Fig. 1
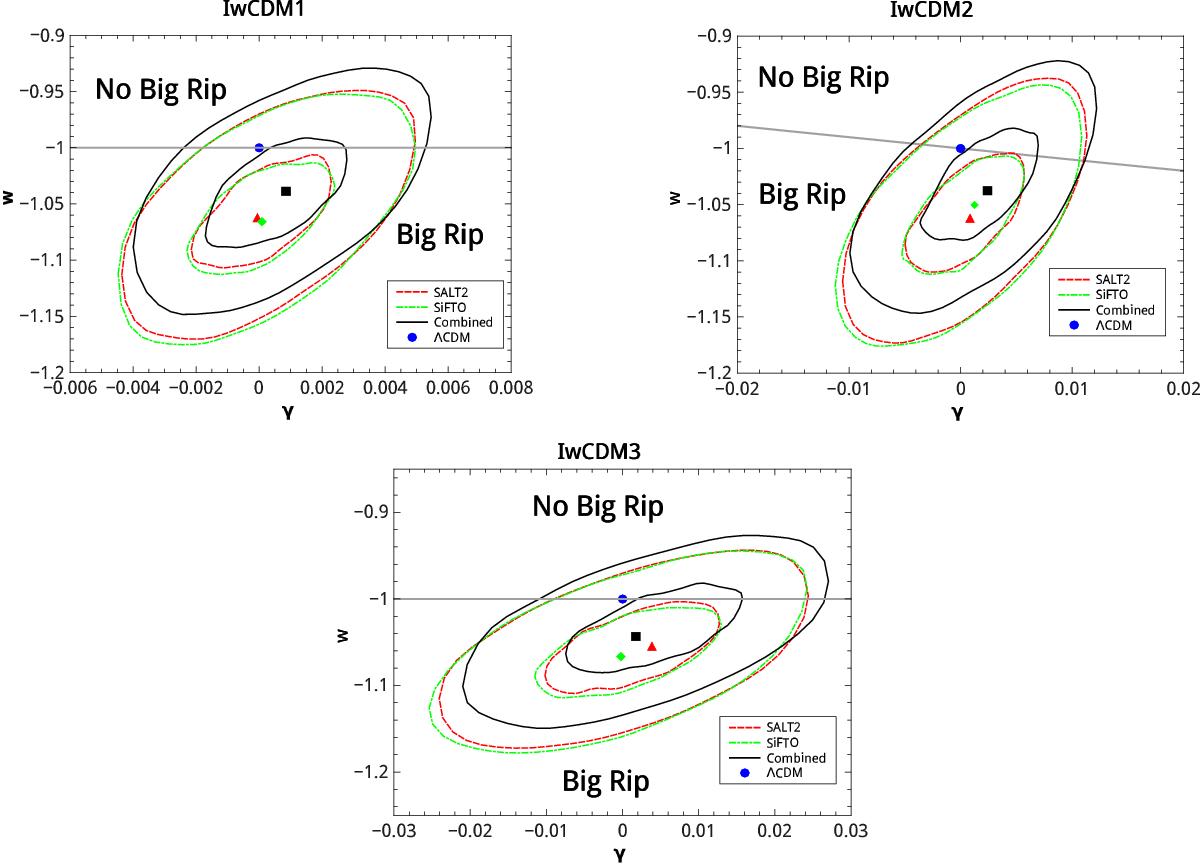
Probability contours at the 1σ and 2σ CL in the γ–w plane, for the IwCDM1 (upper left panel), the IwCDM2 (upper right panel) and the IwCDM3 (lower panel) model. combined (black solid lines), SALT2 (red dashed lines), and SiFTO (green dash-dotted lines) denote the results given by the SN(combined)+CMB+GC, the SN(SALT2)+CMB+GC, and the SN(SiFTO)+CMB+GC data, respectively. Furthermore, the best-fit values of { γ,w } of the combined, SALT2 and the SiFTO data are marked as a black square, a red triangle and a green diamond, respectively. To make a comparison, the fixed point { γ,w } = { 0,−1 } for the ΛCDM model is also marked as a blue round dot. The gray solid line divides the panel into two regions: the region above the dividing line denotes a quintessence dominated Universe (without big rip), and the region below the dividing line represents a phantom dominated Universe (with big rip).
Current usage metrics show cumulative count of Article Views (full-text article views including HTML views, PDF and ePub downloads, according to the available data) and Abstracts Views on Vision4Press platform.
Data correspond to usage on the plateform after 2015. The current usage metrics is available 48-96 hours after online publication and is updated daily on week days.
Initial download of the metrics may take a while.