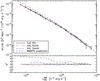
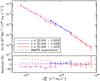
Fig. 12

Differential luminosity function of the XXL-100-GC sample in the WMAP9 cosmology measured with the cumulative estimator defined by Eq. (7). The effective volume correction derives from the XXL-100-GC scaling relations provided in Table 1. The dashed lines show the predictions of the luminosity function in the WMAP9 cosmological model for the same redshift bins as the measurements, and using the same colour code. Left: differential luminosity function averaged over the full redshift range of [0–1.2] covered by the XXL-100-GC sample, and for the northern/southern field separately. The χ2 plot shows how the deviation of each subfield from the complete analysis compares with the combined error bars. Right: differential luminosity function of the bright XXL cluster sample in three redshift bins. The lower plot shows the residuals with respect to the low-redshift WMAP9 prediction.
Current usage metrics show cumulative count of Article Views (full-text article views including HTML views, PDF and ePub downloads, according to the available data) and Abstracts Views on Vision4Press platform.
Data correspond to usage on the plateform after 2015. The current usage metrics is available 48-96 hours after online publication and is updated daily on week days.
Initial download of the metrics may take a while.