Fig. 10
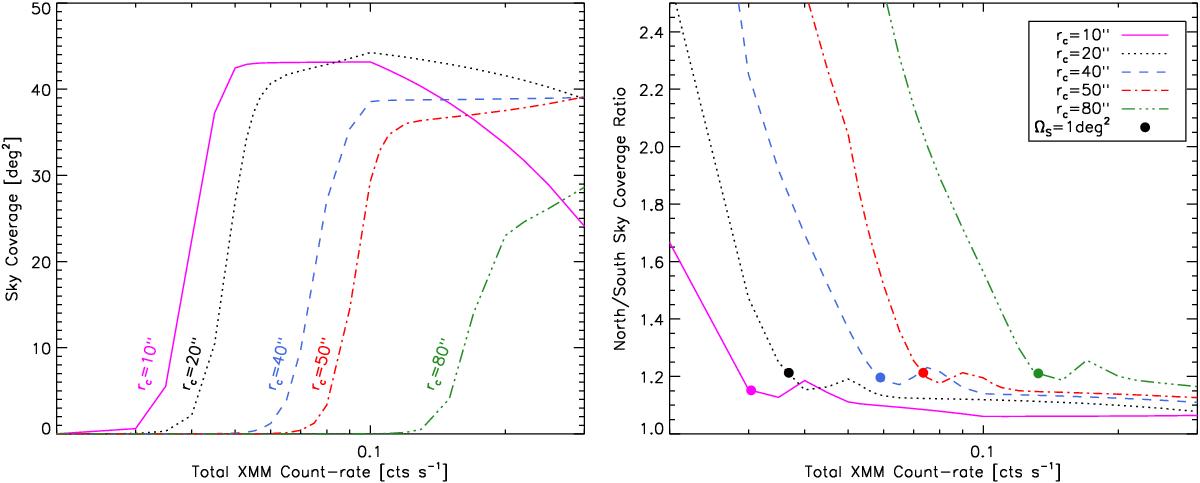
Sky coverage of the XXL-100-GC sample, displayed as a function of the total XMM count rate (i.e. including the three imaging cameras and integrated to infinite radius). Left: total sky coverage for different cluster core radii. These curves are the slices through the two-parameter selection function displayed in Fig. 9. Right: ratio of sky coverage between the northern and southern fields. For sufficiently large count-rates, the sky coverage of the northern field is consistently 10–15% larger than in the south, while the difference is more pronounced when the total sky coverage falls below 1 deg2.
Current usage metrics show cumulative count of Article Views (full-text article views including HTML views, PDF and ePub downloads, according to the available data) and Abstracts Views on Vision4Press platform.
Data correspond to usage on the plateform after 2015. The current usage metrics is available 48-96 hours after online publication and is updated daily on week days.
Initial download of the metrics may take a while.