Fig. 5
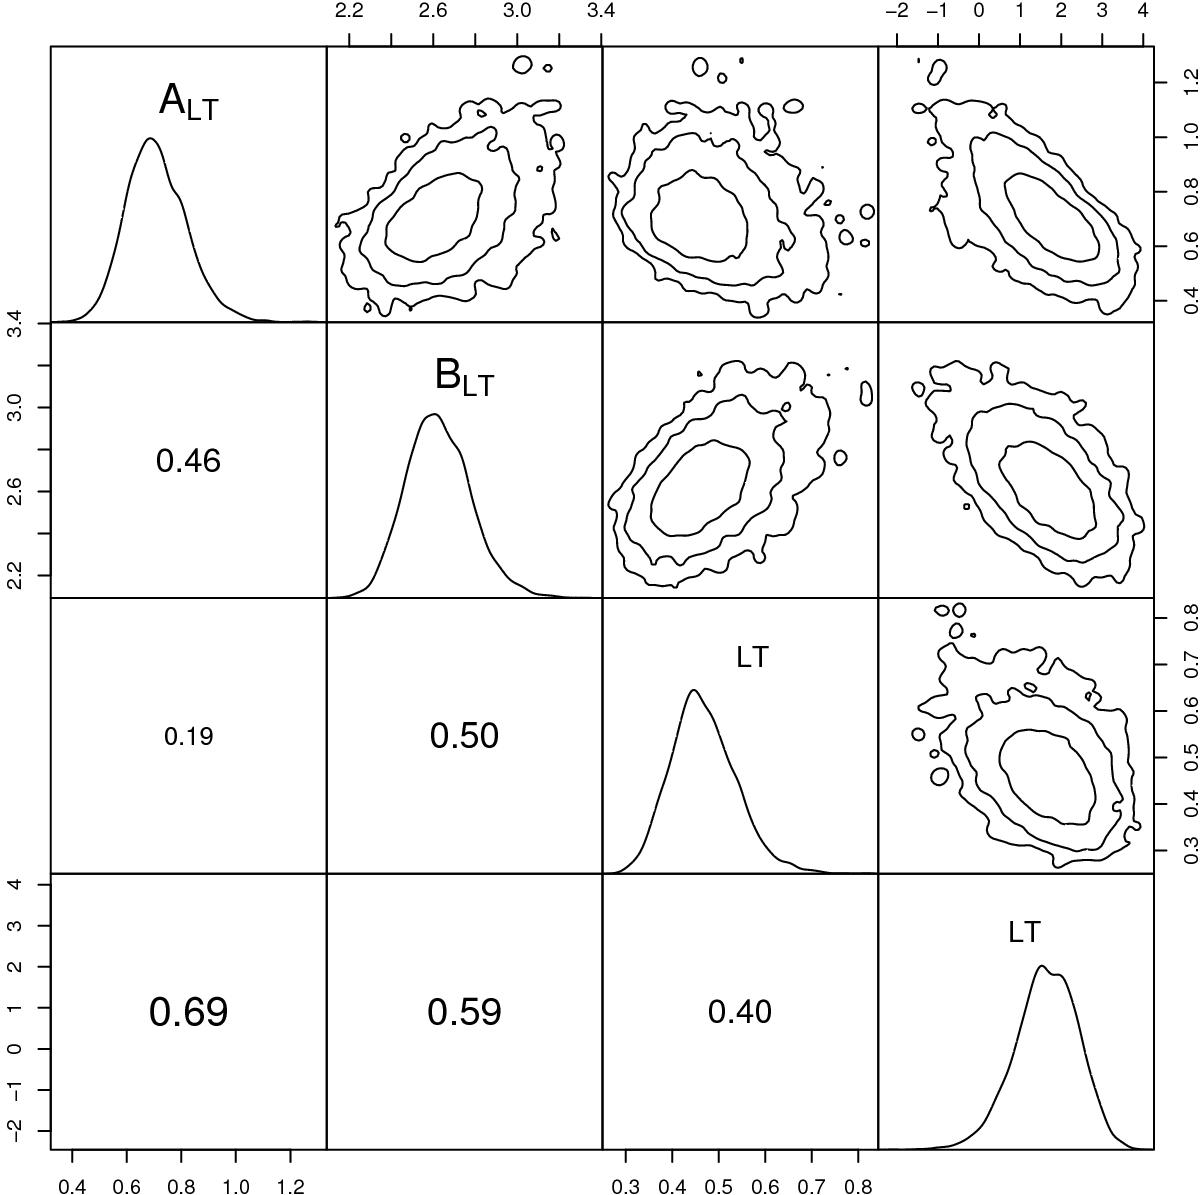
Scatterplot matrix for the fit of the LXXL-T relation of the XXL-100-GC sample. The posterior densities are shown along the diagonal; the 1σ, 2σ, and 3σ confidence contours for the pairs of parameters are shown in the upper right panels. The lower left panels show the Pearson’s correlation coefficient for the corresponding pair of parameters (text size is proportional to the correlation strength).
Current usage metrics show cumulative count of Article Views (full-text article views including HTML views, PDF and ePub downloads, according to the available data) and Abstracts Views on Vision4Press platform.
Data correspond to usage on the plateform after 2015. The current usage metrics is available 48-96 hours after online publication and is updated daily on week days.
Initial download of the metrics may take a while.