Fig. 2
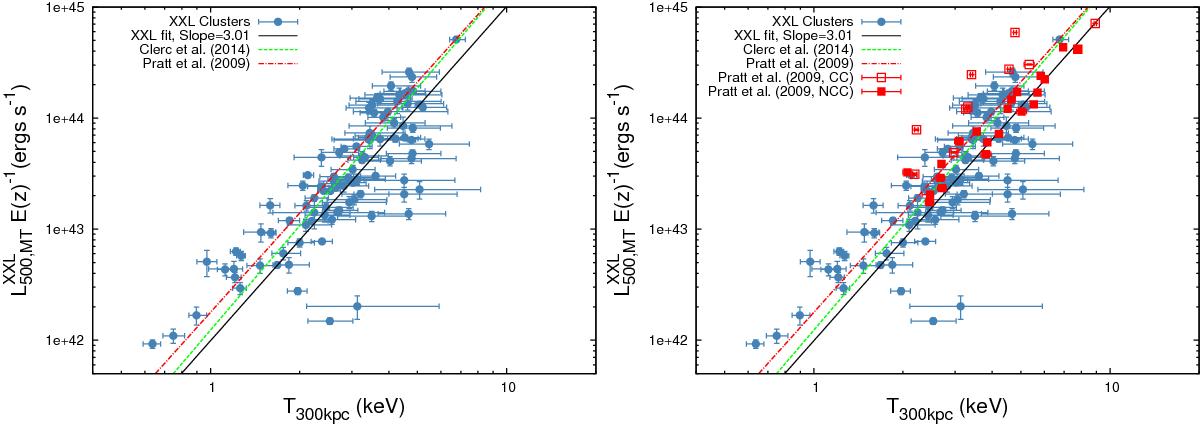
Left: LT relation for the XXL sample. The black line represents an unbiased fit to the data (see Sect. 4.1). The LT relations of Pratt et al. (2009) and Clerc et al. (2014), given by the red dot-dashed line and the green dashed line, respectively, are overplotted; right: same as the left plot, but with the REXCESS clusters studied in Pratt et al. (2009) overplotted, split between cool-core (open red squares) and non-cool-core (filled red squares) clusters. In both plots, the errors on the temperatures for the XXL clusters have been transformed via the method described in Sect. 4.
Current usage metrics show cumulative count of Article Views (full-text article views including HTML views, PDF and ePub downloads, according to the available data) and Abstracts Views on Vision4Press platform.
Data correspond to usage on the plateform after 2015. The current usage metrics is available 48-96 hours after online publication and is updated daily on week days.
Initial download of the metrics may take a while.