Fig. 2
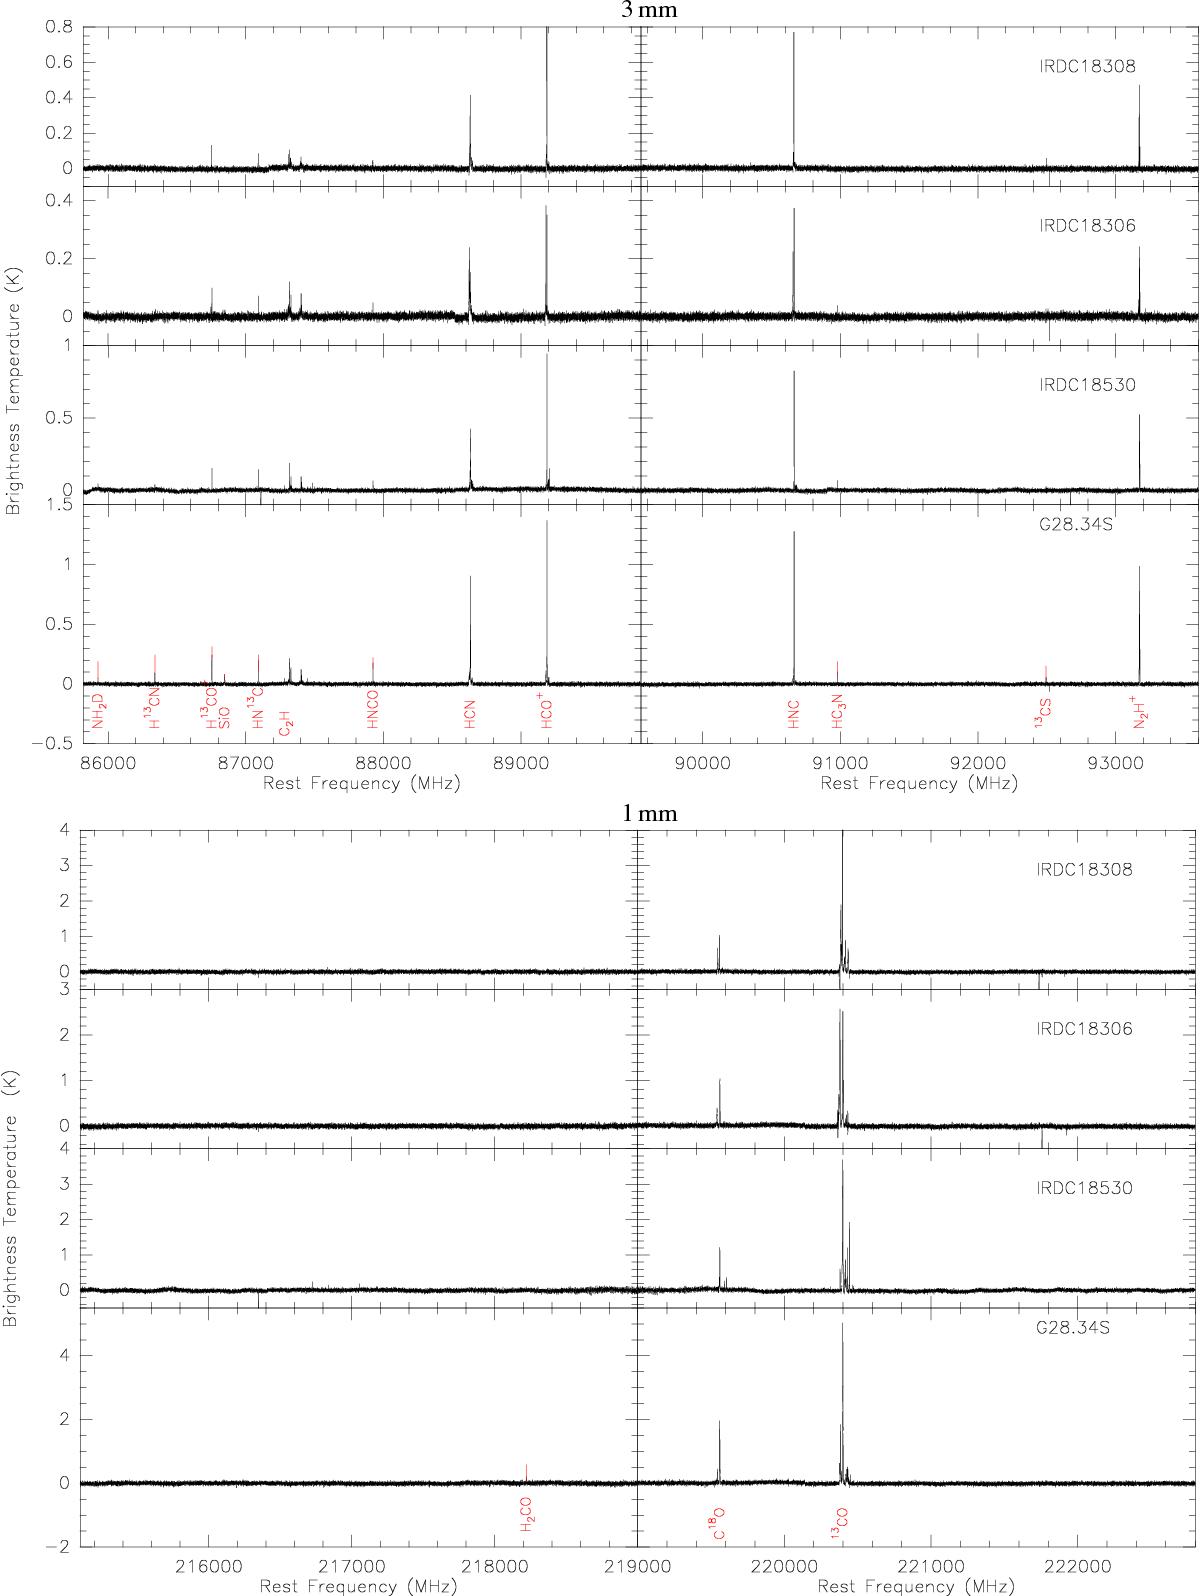
Averaged spectra from IRAM 30 m line survey at 3 mm/1 mm, which are extracted from a square region ([20′′, 20′′] to [−20′′, −20′′] offset) centered on the SMA continuum peak. The spectral resolution is 0.194 MHz (0.265 km s-1 at 1 mm and 0.641 km s-1 at 3 mm). All detected lines are labeled. The “extra band” is not shown here because of less integration time and thus there is a lower signal-to-noise ratio.
Current usage metrics show cumulative count of Article Views (full-text article views including HTML views, PDF and ePub downloads, according to the available data) and Abstracts Views on Vision4Press platform.
Data correspond to usage on the plateform after 2015. The current usage metrics is available 48-96 hours after online publication and is updated daily on week days.
Initial download of the metrics may take a while.