Fig. A.1
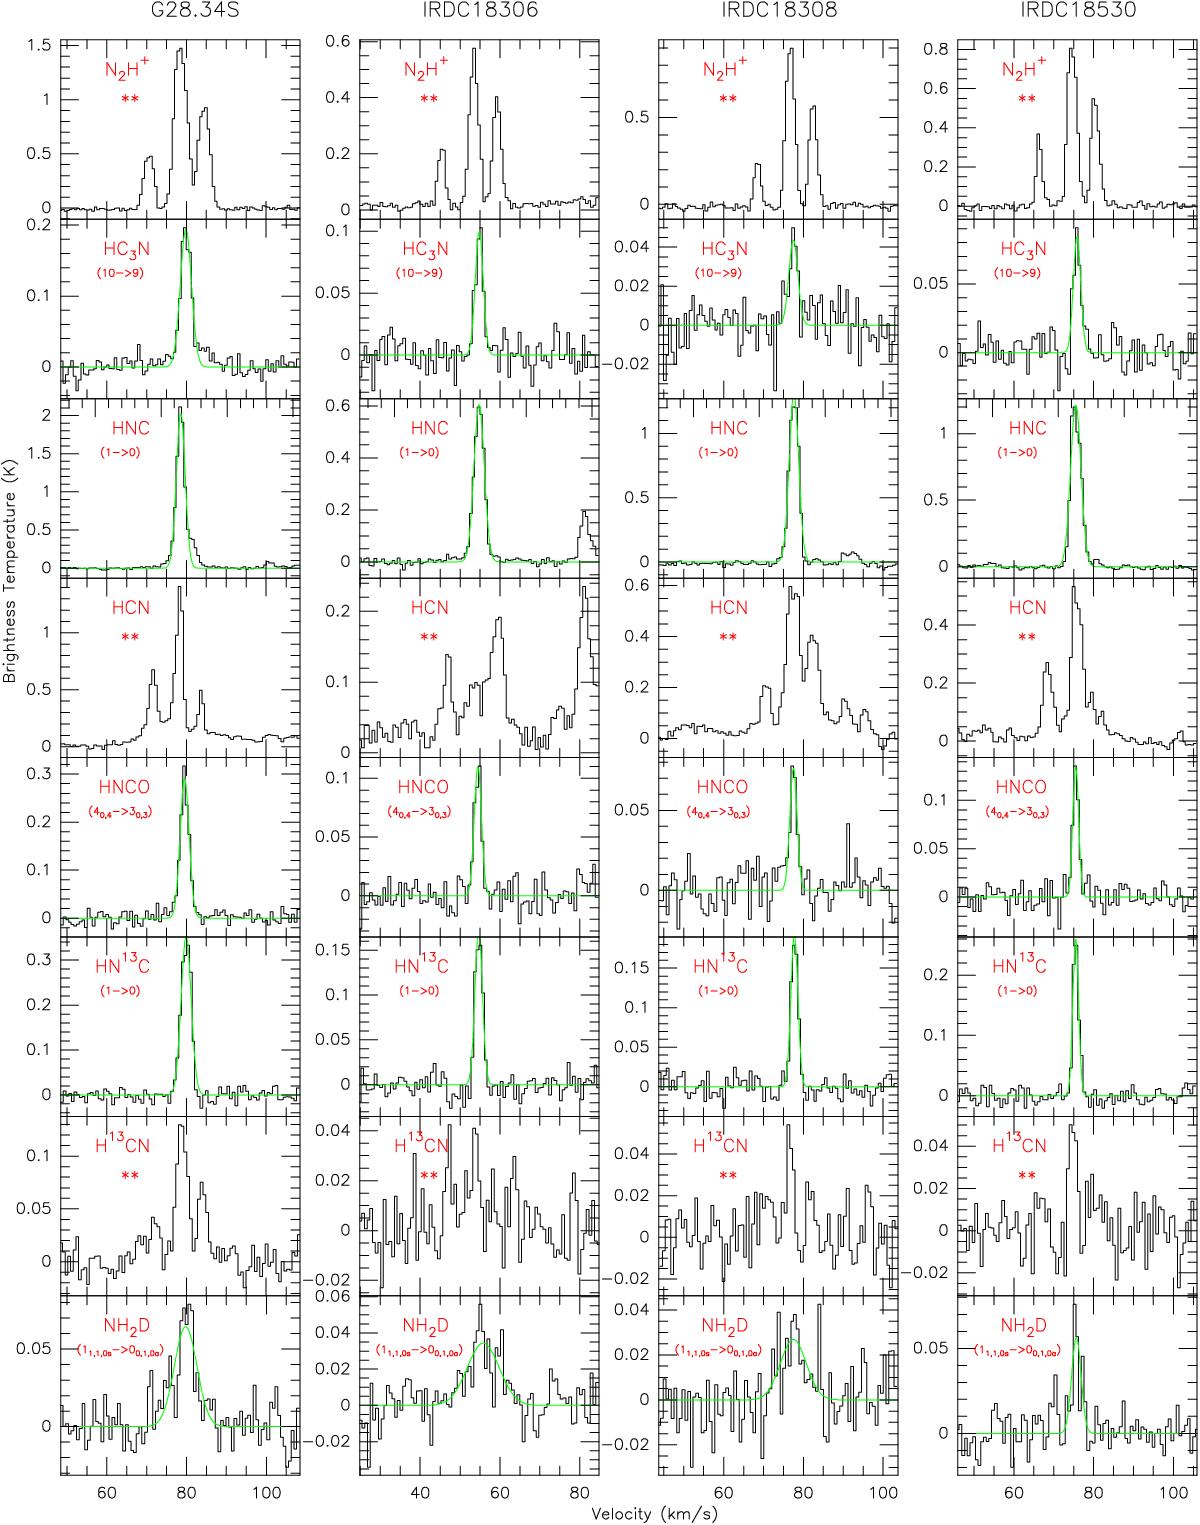
Line profiles of identified species toward each IRDC, ordered in groups as described in Sect. 3.2.2. The green line is from a single-Gaussian fit. “**” denotes a species with hyperfine multiplets whose HFS fits are plotted in Fig. 5. Profiles in blue denote the lines we detect from the “extra band” where the rms are higher than the others owing to less observation time.
Current usage metrics show cumulative count of Article Views (full-text article views including HTML views, PDF and ePub downloads, according to the available data) and Abstracts Views on Vision4Press platform.
Data correspond to usage on the plateform after 2015. The current usage metrics is available 48-96 hours after online publication and is updated daily on week days.
Initial download of the metrics may take a while.