Fig. 1
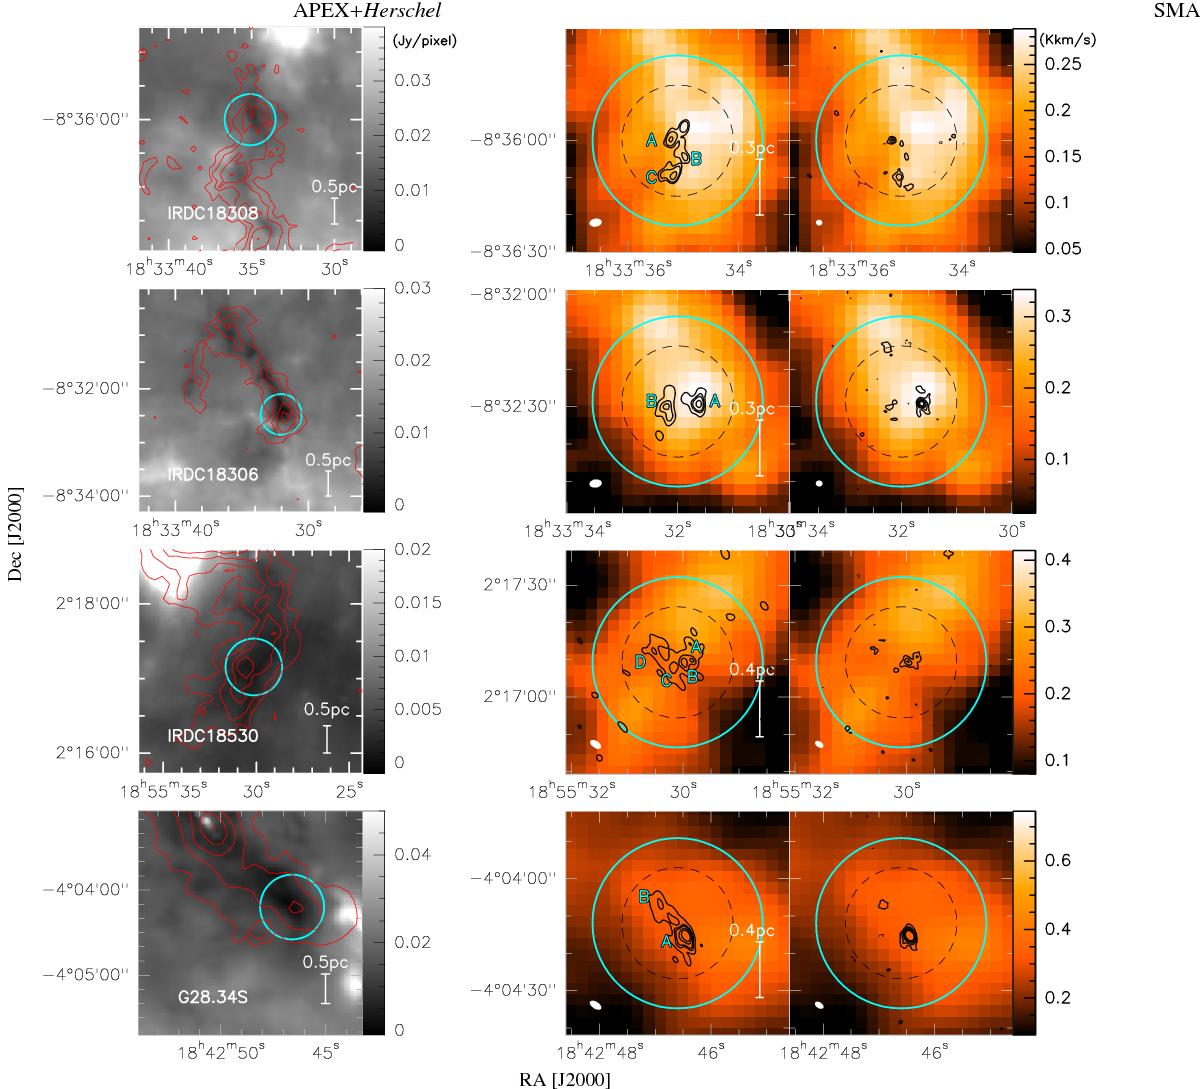
Compilation of the continuum data from 70 μm to 1.1 mm wavelength for G28.34 S, IRDC 18530, IRDC 18306, and IRDC 18308. Left column: graymaps of the dust emission observed by Herschel at 70 μm (Ragan et al. 2012a). The red contours show continuum emission observed by ATLASGAL at 870 μm (Schuller et al. 2009), starting from 10σ rms and continuing in 10σ rms steps. Middle and Right columns: black contours show continuum observed by SMA COMP configuration (middle) and COMP+EXT combination (right), overlaying the moment 0 colormaps of H13CO+(1 → 0) (integrated through its velocity dispersion) from IRAM 30 m observations. COMP contours start from 5σ rms and continue in 5σ rms steps, while COMP+EXT contours start from 3σ and continue in 3σ steps. 1σ rms of each source configuration is listed in Table 3. Cyan letters mark the fragments having >3σ rms continuum emission in both COMP and COMP+EXT maps. In each panel of the middle and right columns, the SMA synthesized beam is in the bottom left. The cyan circles show the primary beam of SMA at 1.1 mm, and the black dashed circles show the beam of 30 m at 3 mm.
Current usage metrics show cumulative count of Article Views (full-text article views including HTML views, PDF and ePub downloads, according to the available data) and Abstracts Views on Vision4Press platform.
Data correspond to usage on the plateform after 2015. The current usage metrics is available 48-96 hours after online publication and is updated daily on week days.
Initial download of the metrics may take a while.