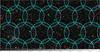
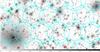
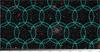
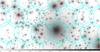
Fig. 9

Output of the XXL detection pipeline for extended sources for the numerical simulations displayed in Fig. 8. Left: synthetic XMM images of the simulations assuming 10 ks exposures, with a random AGN population and diffuse background added and all XMM instrumental effects modelled. Clusters identified by the detection pipeline as C1 and C2 are indicated by red and green crosses, respectively. The 13′ radius circles represent the XMM detector region where source analysis is performed by the XXL standard processing, The pointing spacing is 20′, as in the real XXL observations. Right: sources are shown overlaid on the input map (Fig. 8) now displayed in grey scale. The visual impression is that of a very good agreement between the bright extended simulated structures and the pipeline detections: the only missed bright structure (top left panel) is a double-peaked halo that has been resolved into two point sources by Xamin v3.3 as suggested by the photon image, but recovered as a single extended object by v3.4 (Faccioli et al., in prep.); some C2 detections appear not to correspond to any significant structure in the simulations and are most likely induced by the additional AGNs and background components; by definition, the weak C2 selection allows for a ~50% contamination by non-cluster sources.
Current usage metrics show cumulative count of Article Views (full-text article views including HTML views, PDF and ePub downloads, according to the available data) and Abstracts Views on Vision4Press platform.
Data correspond to usage on the plateform after 2015. The current usage metrics is available 48-96 hours after online publication and is updated daily on week days.
Initial download of the metrics may take a while.