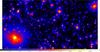
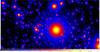
Fig. 8

Simulated surface brightness maps showing thermal X-ray emission ([0.5−2] keV band) from halos in independent 1 × 2 deg2 patches derived from direct hydrodynamical simulation (top) and from scaled templates applied to N-body halos (bottom). The largest halo in each image has a mass (M500c) of 3.8 and 3.1 × 10¹³ M⊙, top and bottom panels respectively, both are at z = 0.035. The X-ray intensity scale is the same for both images.
Current usage metrics show cumulative count of Article Views (full-text article views including HTML views, PDF and ePub downloads, according to the available data) and Abstracts Views on Vision4Press platform.
Data correspond to usage on the plateform after 2015. The current usage metrics is available 48-96 hours after online publication and is updated daily on week days.
Initial download of the metrics may take a while.