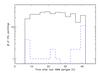
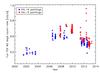
Fig. 3

Left: distribution of the pointing times over the orbit visibility periods for the AO10 XXL observations (black); the blue dashed histogram shows the flared observations discarded because less than 7 ks were usable after filtering. Right: the history of XMM-LSS, XMM-BCS, and XXL backgrounds in the soft band at the centre of the MOS2 detector (after 3σ clipping) from our analysis pipeline. A maximum is seen around year 2010, which corresponds to solar minimum, as expected since the rate of cosmic-ray intensity is anti-correlated with the solar activity (Neher & Forbush 1958). Similar behaviour is seen for MOS1 and pn.
Current usage metrics show cumulative count of Article Views (full-text article views including HTML views, PDF and ePub downloads, according to the available data) and Abstracts Views on Vision4Press platform.
Data correspond to usage on the plateform after 2015. The current usage metrics is available 48-96 hours after online publication and is updated daily on week days.
Initial download of the metrics may take a while.