Fig. 2
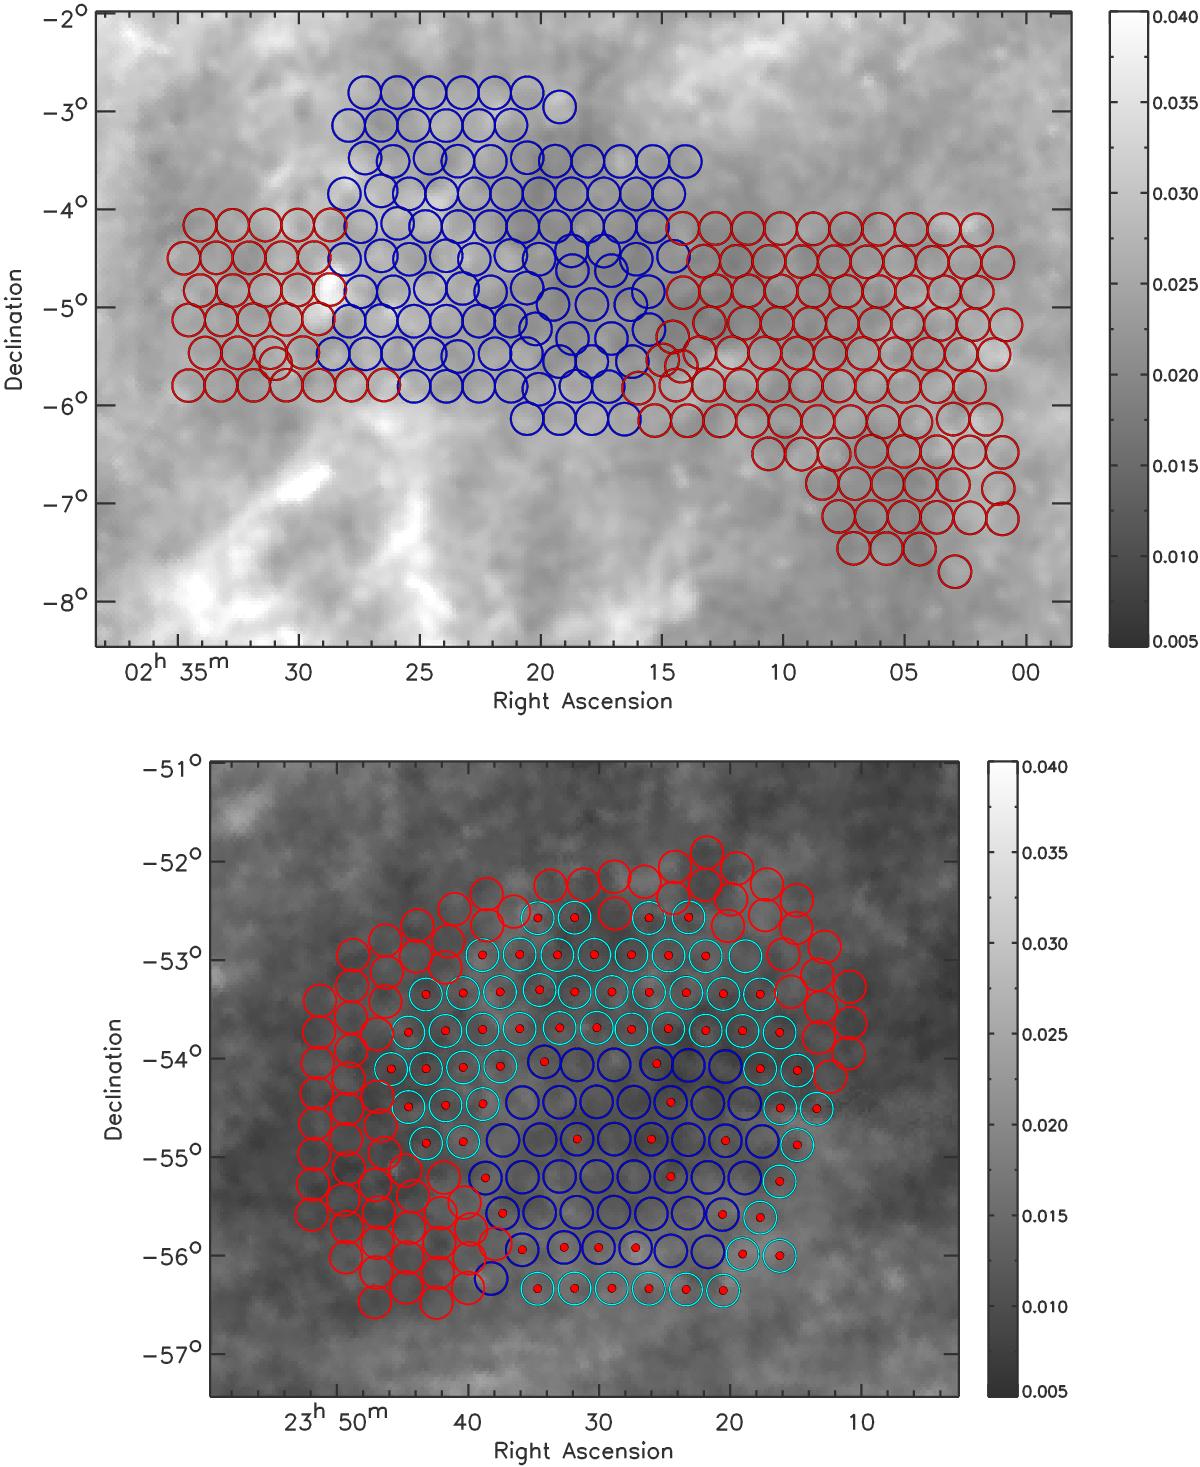
Layout of the XMM XXL observations; only survey-type observations are indicated in the figure. Top: XXL-N. Bottom: XXL-S. The footprint of the XMM observations is shown on maps of dust column density calibrated to E(B−V) reddening in magnitude (Schlegel et al. 1998); the circles have a diameter of 20 arcmin (the entire XMM field of view encompasses 30 arcmin). The blue circles show the pre-XXL observations and the light blue circles indicate the pre-XXL observations done in mosaic mode. The red circles stand for the XXL AO-10 observations, all of which were done is mosaic mode. Already existing observations completed to 10 ks within the AO-10 time-allocation are marked by a red dot.
Current usage metrics show cumulative count of Article Views (full-text article views including HTML views, PDF and ePub downloads, according to the available data) and Abstracts Views on Vision4Press platform.
Data correspond to usage on the plateform after 2015. The current usage metrics is available 48-96 hours after online publication and is updated daily on week days.
Initial download of the metrics may take a while.