Fig. 3
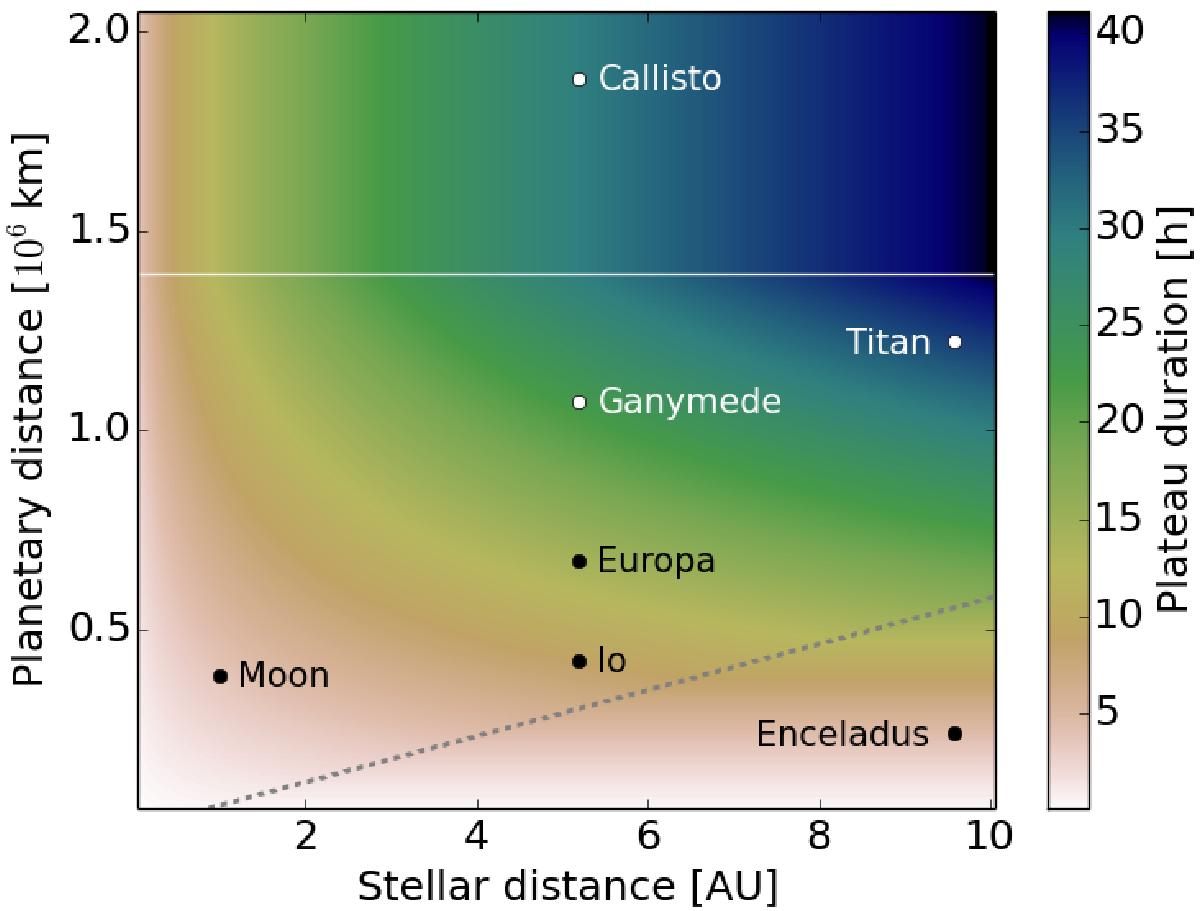
The so-called plateau duration for different stellar and planetary distances. The masses of the star and the planet are 1 solar mass and 1MJ, respectively, for all cases. Black and white colours indicate the longest (41 h) and the shortest (6 min) plateau durations, respectively. The dashed grey line separates those cases where the moon’s orbital velocity is high enough to reach 25% of its orbit before the plateau duration ends (in the bottom right corner). The solid horizontal white line at about 1 393 000 km (2 R⋆) indicates that the plateau duration is constant above this planetary distance. Examples from the solar system are plotted for comparison.
Current usage metrics show cumulative count of Article Views (full-text article views including HTML views, PDF and ePub downloads, according to the available data) and Abstracts Views on Vision4Press platform.
Data correspond to usage on the plateform after 2015. The current usage metrics is available 48-96 hours after online publication and is updated daily on week days.
Initial download of the metrics may take a while.