Free Access
Fig. 6
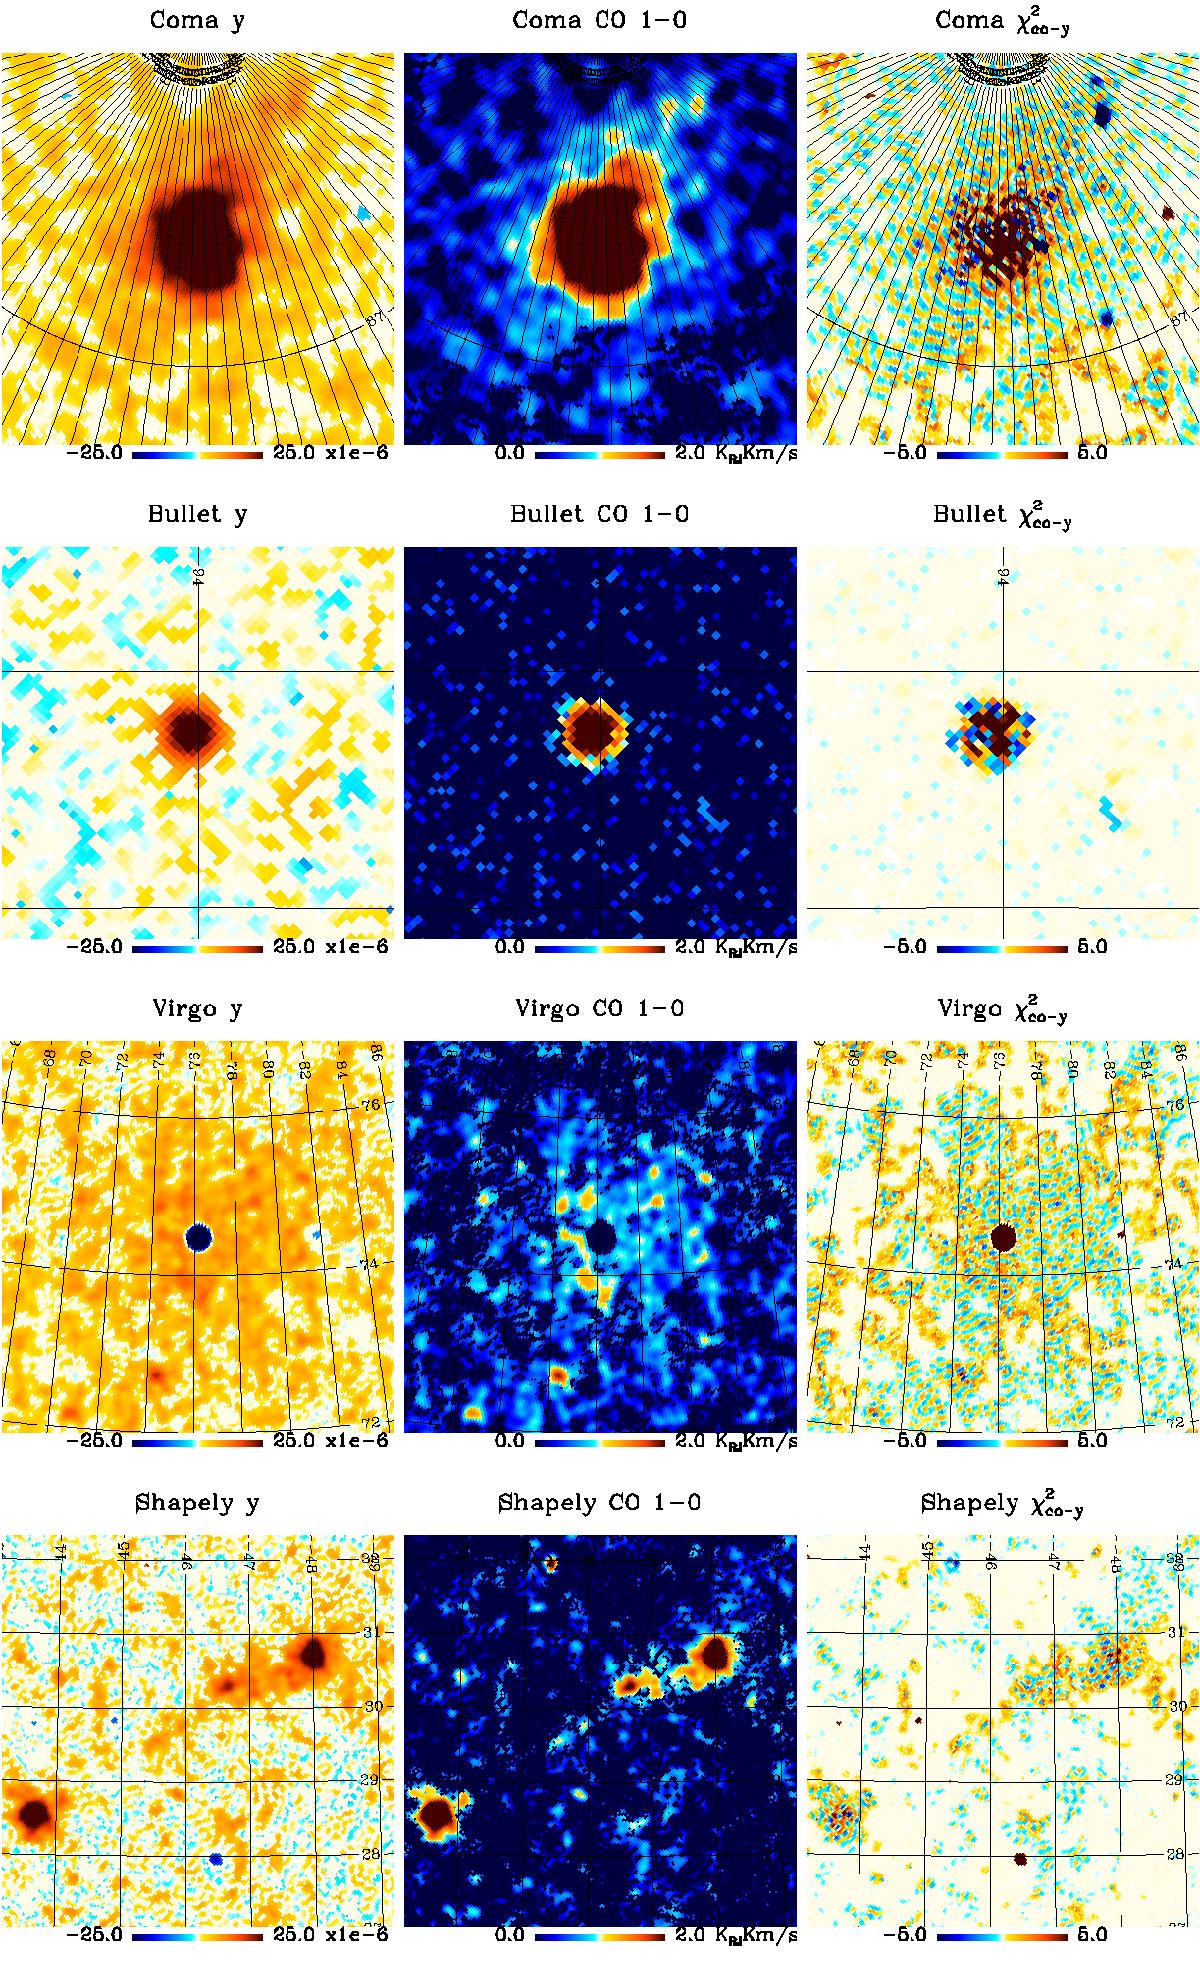
Same as Fig. 5 but for the well known galaxy clusters. The ![]() map at the position has when averaged over many pixels large positive values favoring the y-distortion model over the CO emission. The prominent clusters in the last panels are A3571, A3562, and A3558 in the Shapley supercluster.
map at the position has when averaged over many pixels large positive values favoring the y-distortion model over the CO emission. The prominent clusters in the last panels are A3571, A3562, and A3558 in the Shapley supercluster.
Current usage metrics show cumulative count of Article Views (full-text article views including HTML views, PDF and ePub downloads, according to the available data) and Abstracts Views on Vision4Press platform.
Data correspond to usage on the plateform after 2015. The current usage metrics is available 48-96 hours after online publication and is updated daily on week days.
Initial download of the metrics may take a while.