Fig. A.1
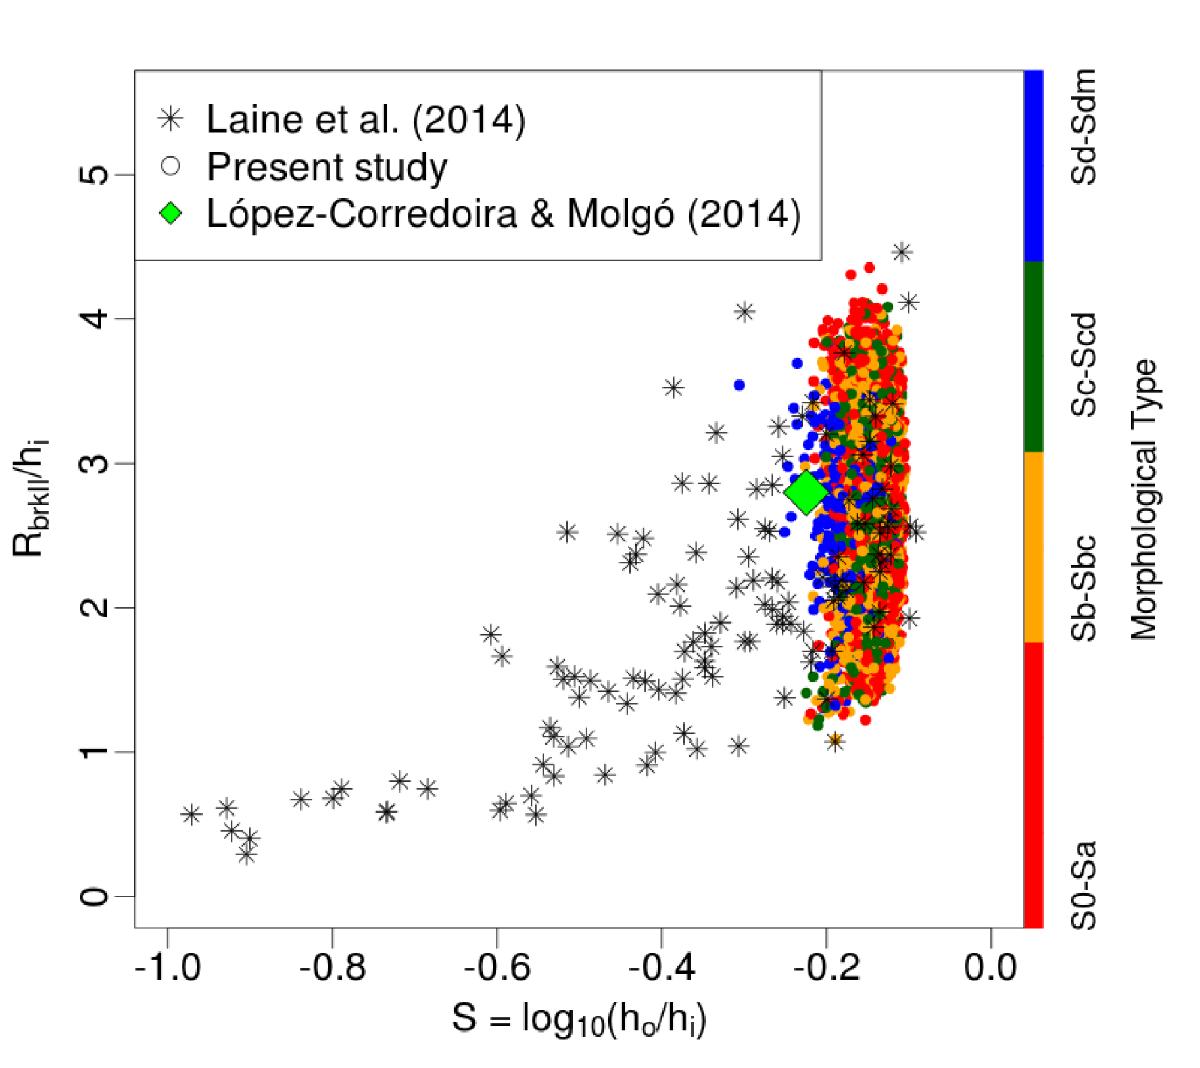
Break radius normalized by the inner disc scale length vs. the break strength S. Our simulations are plotted with coloured circles, colour-coded according to the morphological type of the object simulated object. The edge-on MW model is overplotted with a green diamond. The asterisks represent the Type-II breaks observed by Laine et al. (2014) from the S4G survey. See the legend in the figure.
Current usage metrics show cumulative count of Article Views (full-text article views including HTML views, PDF and ePub downloads, according to the available data) and Abstracts Views on Vision4Press platform.
Data correspond to usage on the plateform after 2015. The current usage metrics is available 48-96 hours after online publication and is updated daily on week days.
Initial download of the metrics may take a while.