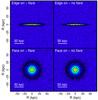
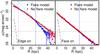
Fig. 2

Top panels: edge-on I-band images for the flared and non-flared models. Intermediate panels: the same for the face-on discs. Bottom panels: surface brightness profiles in the major axis of the galaxy for edge-on (left) and the face-on (right) views of the two models (red: non-flared model, blue: flared model). Blue vertical solid line: flare radius Rflare. Black dot-dashed line: bulge component. Solid blue and red lines: linear fits performed to the inner regions of the disc for the flared and non-flared models. Dashed blue and red lines: the same for the outer regions of the disc. Black dotted lines: bulge re and μevalues. Horizontal dashed black line: limiting magnitude μlim = 25 mag arcsec-2. Vertical dashed magenta line: inner limit for the inner profile. We note that the disc profile in the flared case exhibits a clear Type-II break in the edge-on view, whereas the non-flared model keeps the exponential profile that both models exhibit in the face-on view. See the legend for details.
Current usage metrics show cumulative count of Article Views (full-text article views including HTML views, PDF and ePub downloads, according to the available data) and Abstracts Views on Vision4Press platform.
Data correspond to usage on the plateform after 2015. The current usage metrics is available 48-96 hours after online publication and is updated daily on week days.
Initial download of the metrics may take a while.