Fig. 5
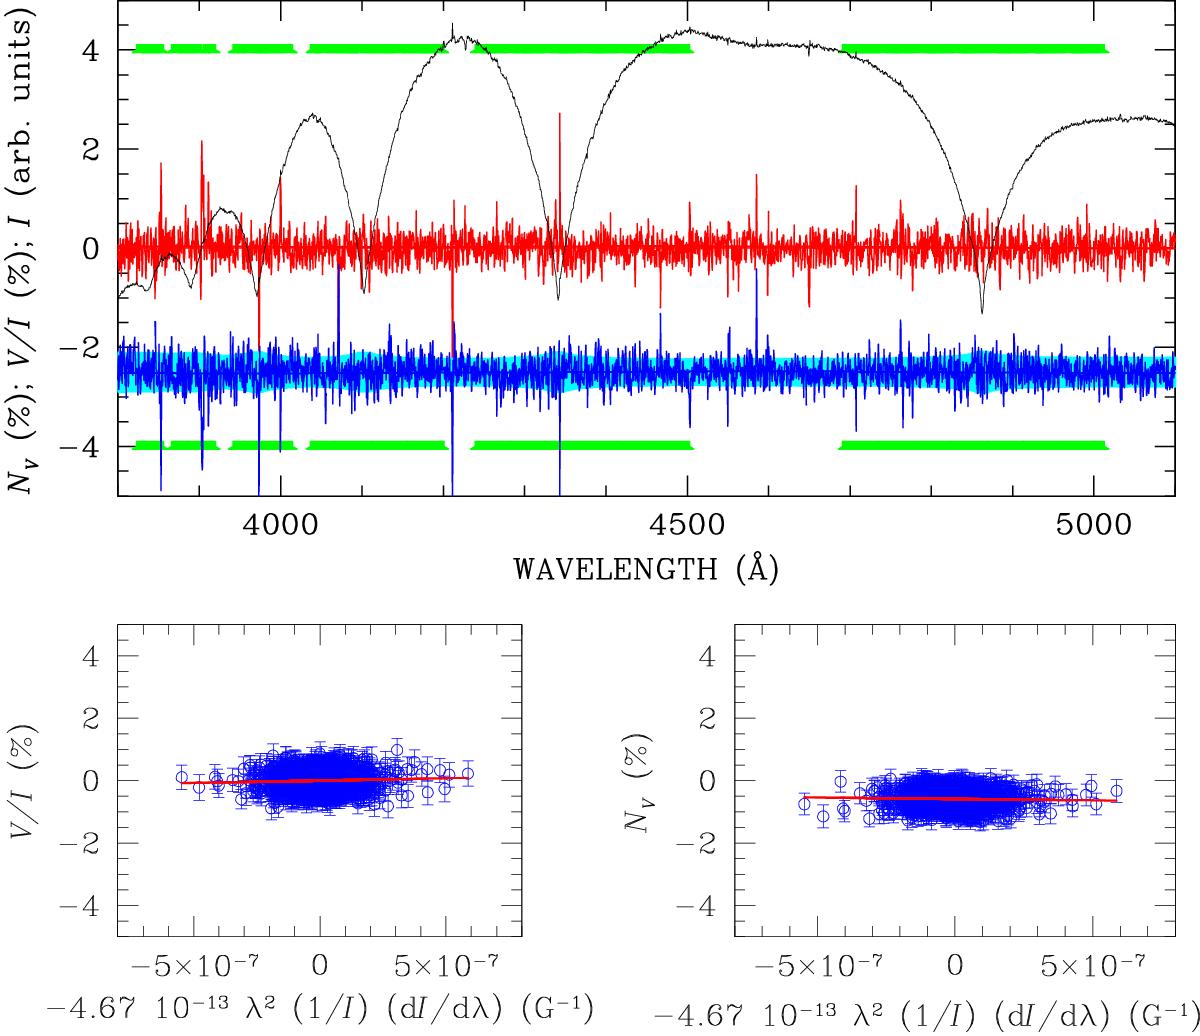
Spectropolarimetry of WD 2047+372. In the upper panel, the black solid line shows the intensity profile, the shape of which is heavily affected by the transmission function of the atmosphere + telescope optics + instrument. The zero level of intensity is very close to the bottom of the panel, at −5 on the left-hand scale. The red solid line is the reduced Stokes V/I profile in % units. Photon-noise error bars are centred around −2.5 % and appear as a light blue background, to which the null profile (also offset by −2.5 % for display purpose) is superposed (blue solid line). The two bottom panels show the best-fit obtained by fitting with a straight line V/I as a function of the quantity ∝ λ2(1 /I) dI/ dλ). The green bars at the top and bottom of the upper panel show the spectral regions included in the correlation plots in the small lower panels.
Current usage metrics show cumulative count of Article Views (full-text article views including HTML views, PDF and ePub downloads, according to the available data) and Abstracts Views on Vision4Press platform.
Data correspond to usage on the plateform after 2015. The current usage metrics is available 48-96 hours after online publication and is updated daily on week days.
Initial download of the metrics may take a while.