Fig. 4
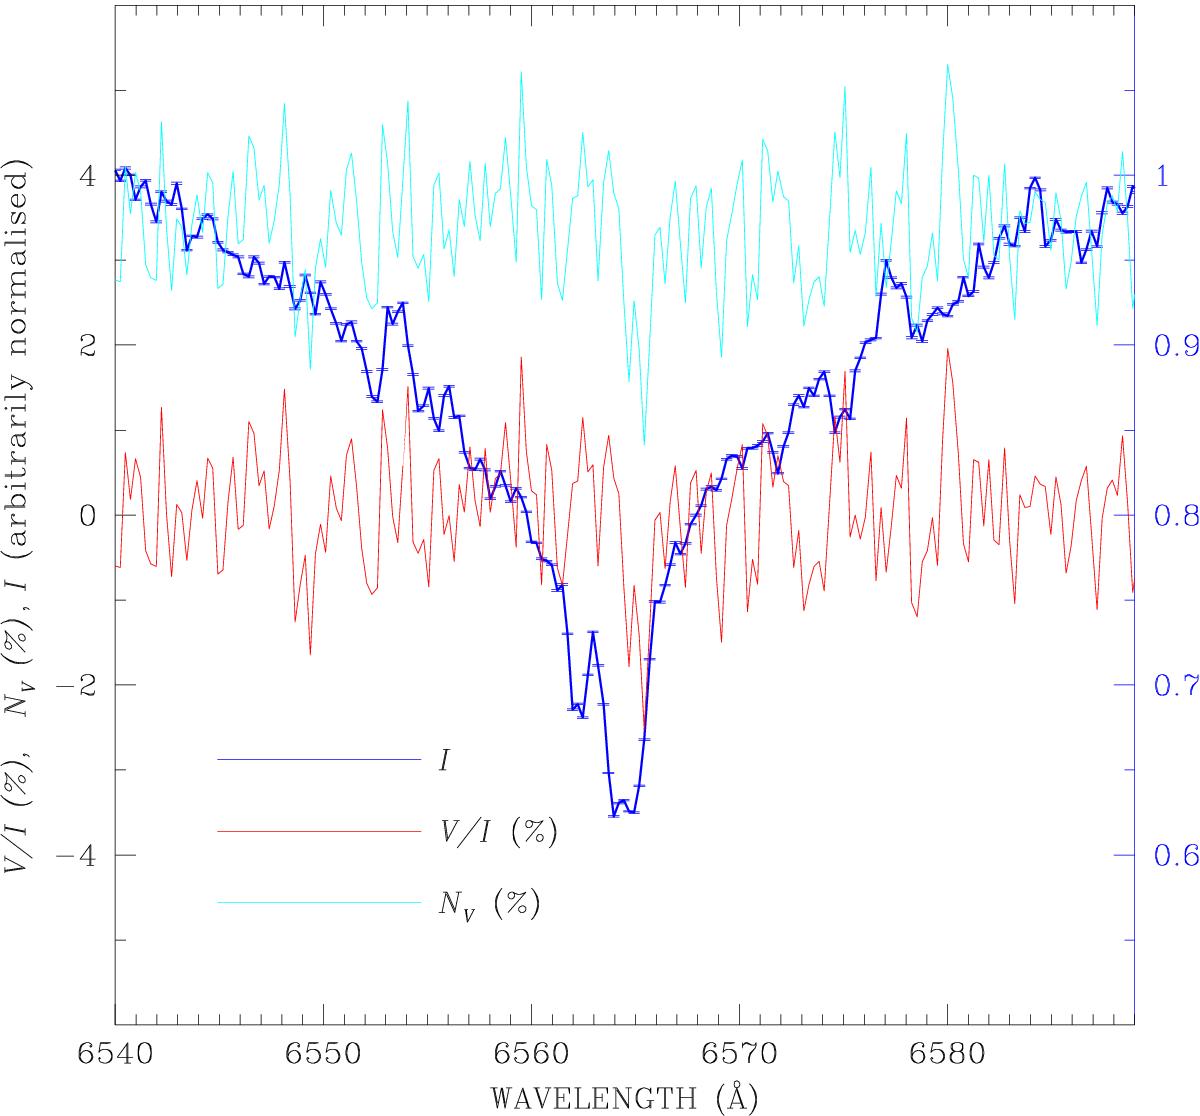
Hα Stokes I (blue solid line) and V/I (red solid line) profiles of WD 2047+372 obtained with ISIS. The null profile is plotted with a solid light blue line, offset by + 3.5 % for display purpose, and the left scale describes these data. The scale for the I spectrum is on the right.
Current usage metrics show cumulative count of Article Views (full-text article views including HTML views, PDF and ePub downloads, according to the available data) and Abstracts Views on Vision4Press platform.
Data correspond to usage on the plateform after 2015. The current usage metrics is available 48-96 hours after online publication and is updated daily on week days.
Initial download of the metrics may take a while.