Free Access
Fig. 3
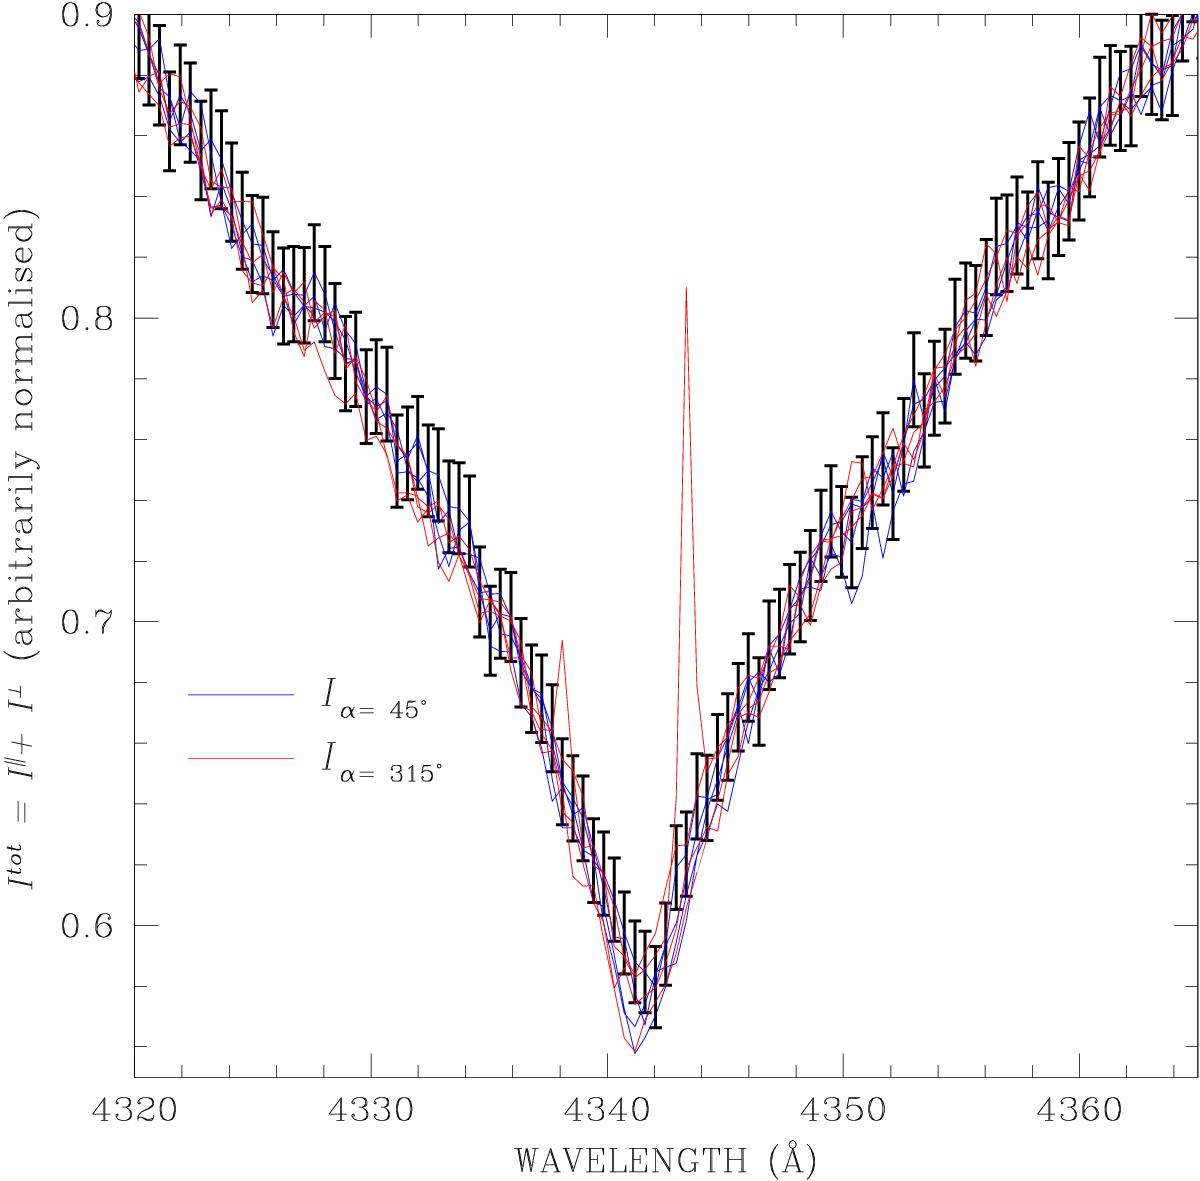
WD 2047+372, Hγ Balmer line: the sum of fluxes in the parallel and perpendicular beam split by the Savart plate, normalised to a pseudo-continuum, for all eight exposures obtained in the observing series, overplotted with the error bars.
Current usage metrics show cumulative count of Article Views (full-text article views including HTML views, PDF and ePub downloads, according to the available data) and Abstracts Views on Vision4Press platform.
Data correspond to usage on the plateform after 2015. The current usage metrics is available 48-96 hours after online publication and is updated daily on week days.
Initial download of the metrics may take a while.