Free Access
Fig. 7
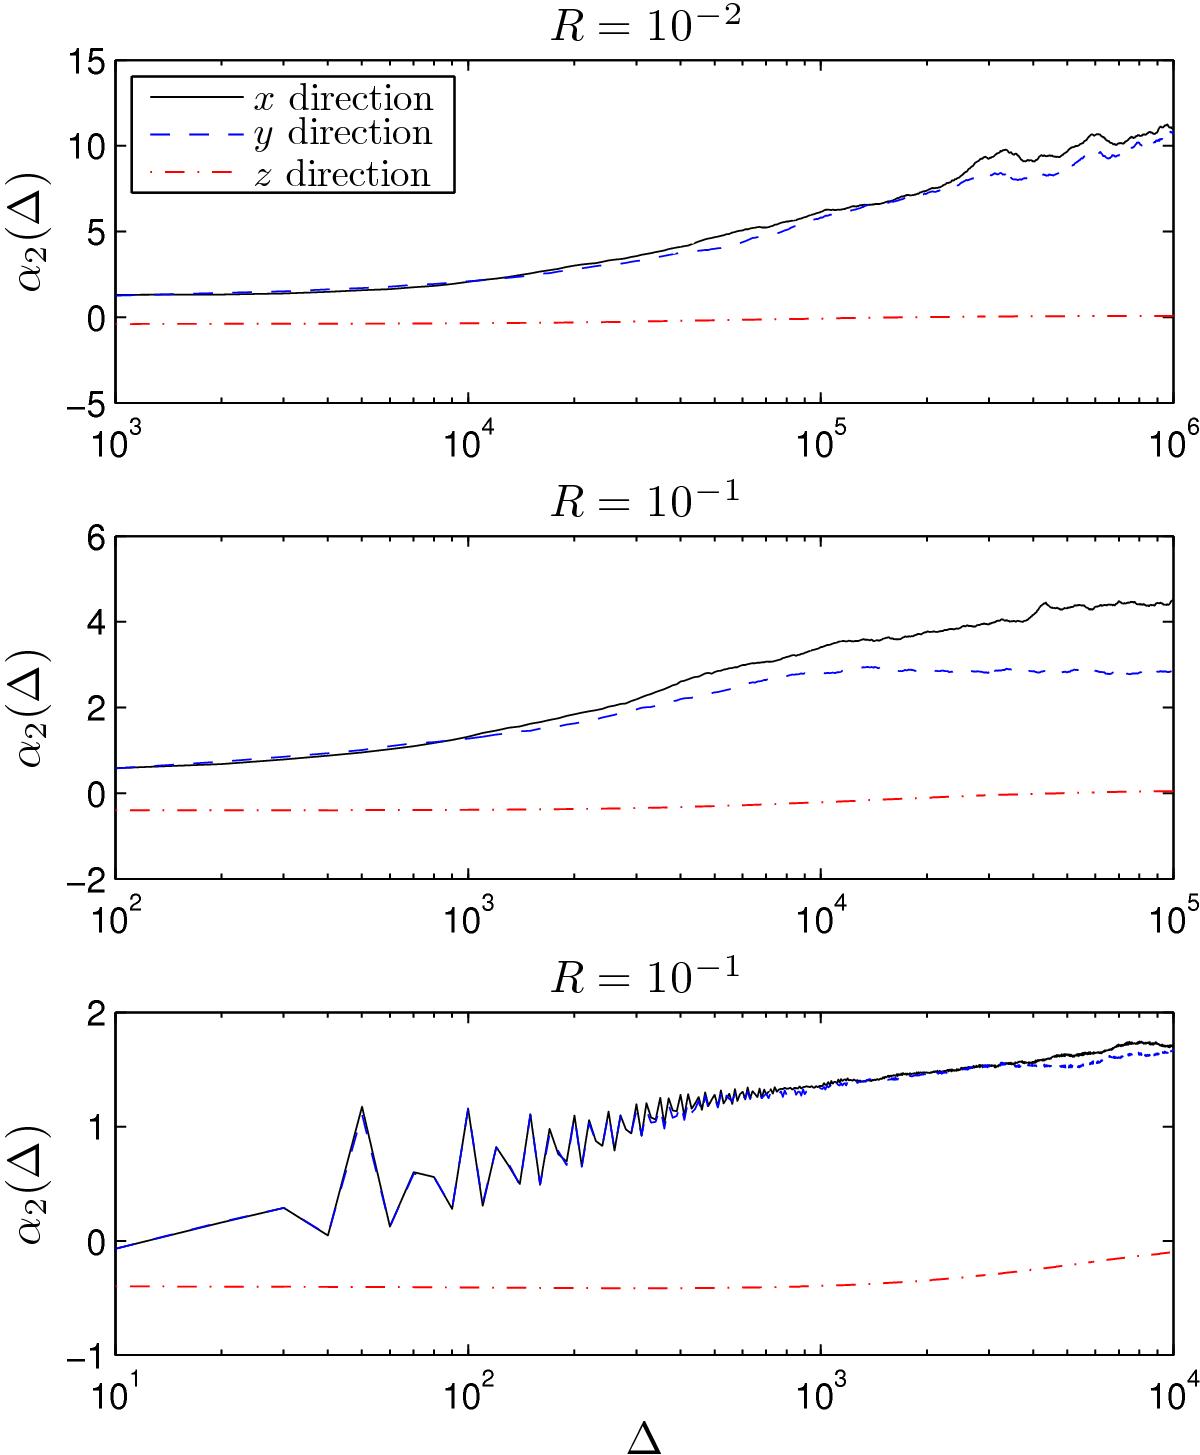
Results for the non-Gaussianity parameter α2 as defined in Eq. (16). In each plot, α2 is shown as a function of the simulation time, t, for the x and y direction (black solid and blue dashed lines, respectively). For comparison purposes, α2 is also shown for the z direction (red dot-dashed line).
Current usage metrics show cumulative count of Article Views (full-text article views including HTML views, PDF and ePub downloads, according to the available data) and Abstracts Views on Vision4Press platform.
Data correspond to usage on the plateform after 2015. The current usage metrics is available 48-96 hours after online publication and is updated daily on week days.
Initial download of the metrics may take a while.