Fig. 4
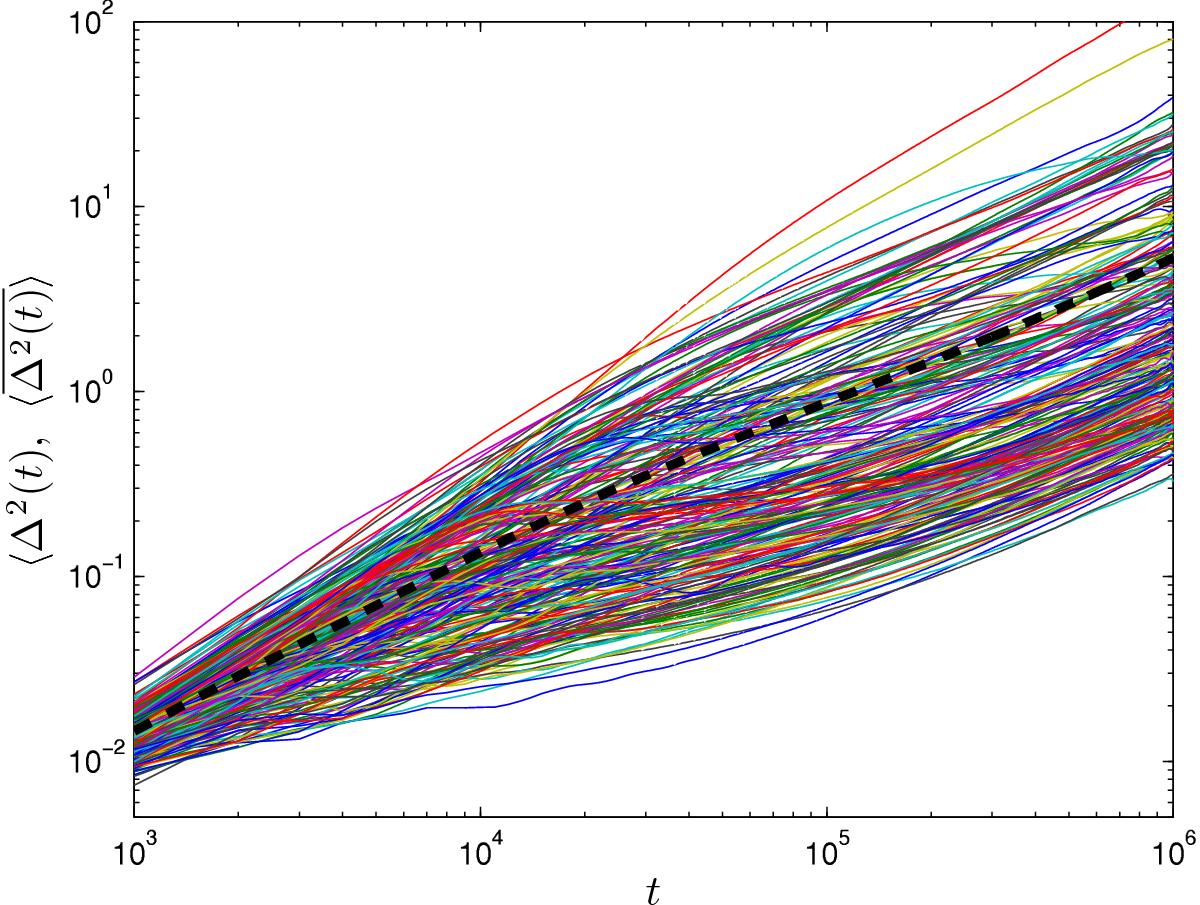
Sample results for the time-averaged MSD as a function of the time lag, t, which is the time variable during the simulation. The dashed black line shows the ensemble-averaged, time-averaged MSD, which can be fitted to a power law ∝ t0.7235 for t ≫ tball, where tball is the ballistic time scale. The colored lines show the ensemble-averaged, time-averaged MSD for individual turbulence realizations.
Current usage metrics show cumulative count of Article Views (full-text article views including HTML views, PDF and ePub downloads, according to the available data) and Abstracts Views on Vision4Press platform.
Data correspond to usage on the plateform after 2015. The current usage metrics is available 48-96 hours after online publication and is updated daily on week days.
Initial download of the metrics may take a while.