Fig. 3
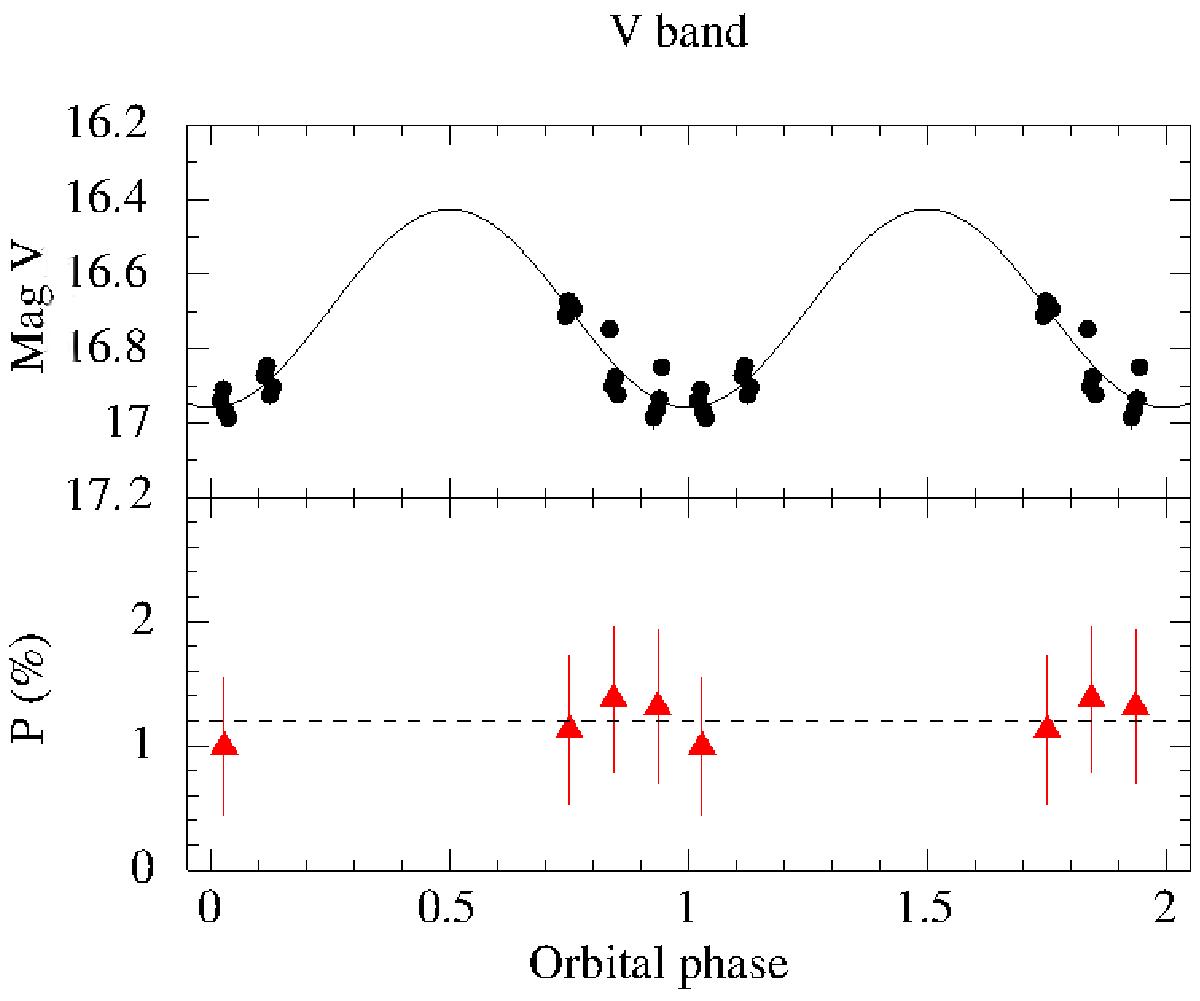
Upper panel: V-band light curve of J1023 (magnitude vs. orbital phase). The solid line represents the fit of the light curve with a sinusoidal function with period fixed to 1 (corresponding to 4.75 h; Archibald et al. 2009). Bottom panel: V-band polarisation curve represented as a function of the orbital phase of the system. The >1σ detections are represented with red triangles, whereas we indicated the 3σ upper limits with red arrows, where necessary. The fit of the >1σ detections with a constant function is superimposed (dashed line; χ2/ d.o.f. = 0.28/3). Errors are represented at the 68% confidence level. Two periods are drawn for clarity.
Current usage metrics show cumulative count of Article Views (full-text article views including HTML views, PDF and ePub downloads, according to the available data) and Abstracts Views on Vision4Press platform.
Data correspond to usage on the plateform after 2015. The current usage metrics is available 48-96 hours after online publication and is updated daily on week days.
Initial download of the metrics may take a while.