Fig. 4
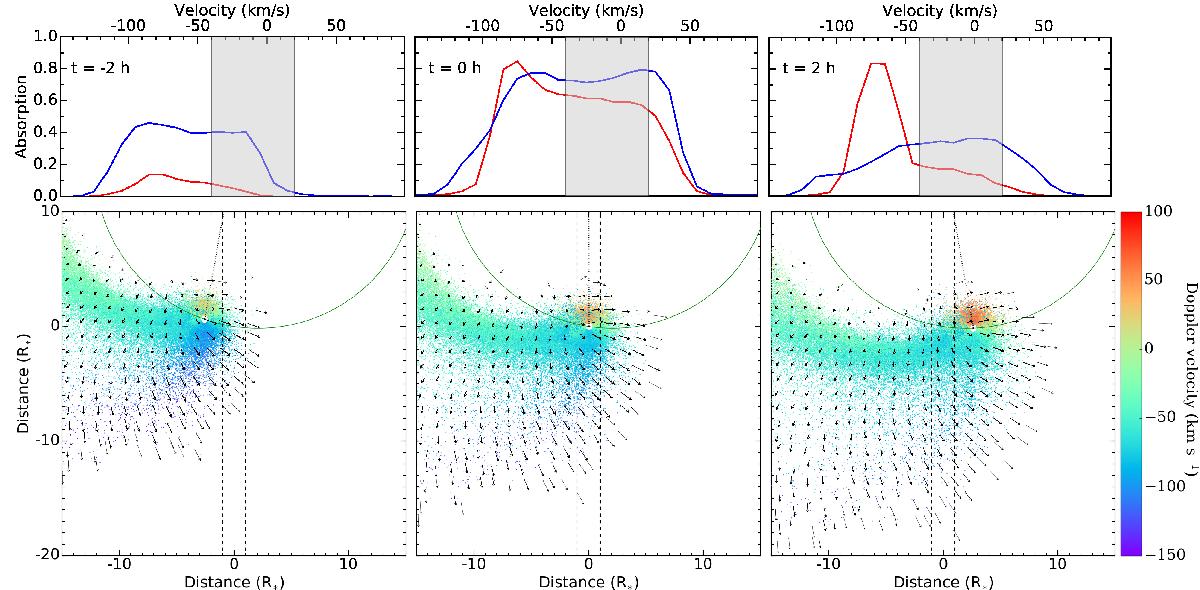
Views of GJ 436 b exosphere (lower panels) and its theoretical absorption profile (upper panels). We caution that absorption in the shaded range ([− 40; 20] km s-1) cannot be observed from Earth and that the STIS LSF would spread the absorption signal from the exosphere over more data points. Time increases from left to right and is indicated in each plot. The dashed black lines limit the LOS toward the stellar disk, while the dotted line indicates the star-planet axis. Black arrows show the velocity field of the gas in the stellar rest frame, with H0 atoms in the orbital plane colored as a function of their LOS-projected velocity. Red lines in the upper panels show the absorption profiles from the exosphere simulated with Visit 3 best-fit parameters. The population of neutralized protons arising from the inner coma can be identified by its radial velocities and stable high-velocity absorption peak, while planetary neutrals remain present at the front of the coma and in the outer regions of the exosphere opposite the star with dynamics dominated by radiative braking. The blue line profiles in the upper panels correspond to the same simulation with no stellar wind, illustrating how charge exchange reduces the size of the exosphere before and after the optical transit but only weakly affects the absorption profile at the center of the transit. It also shows that neutralized protons produce a stable high-velocity absorption peak.
Current usage metrics show cumulative count of Article Views (full-text article views including HTML views, PDF and ePub downloads, according to the available data) and Abstracts Views on Vision4Press platform.
Data correspond to usage on the plateform after 2015. The current usage metrics is available 48-96 hours after online publication and is updated daily on week days.
Initial download of the metrics may take a while.