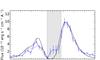
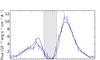
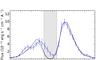
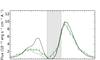
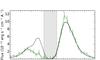
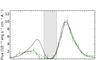
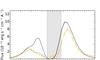
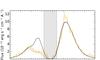
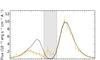
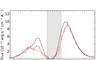
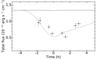
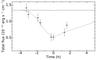
Fig. 2
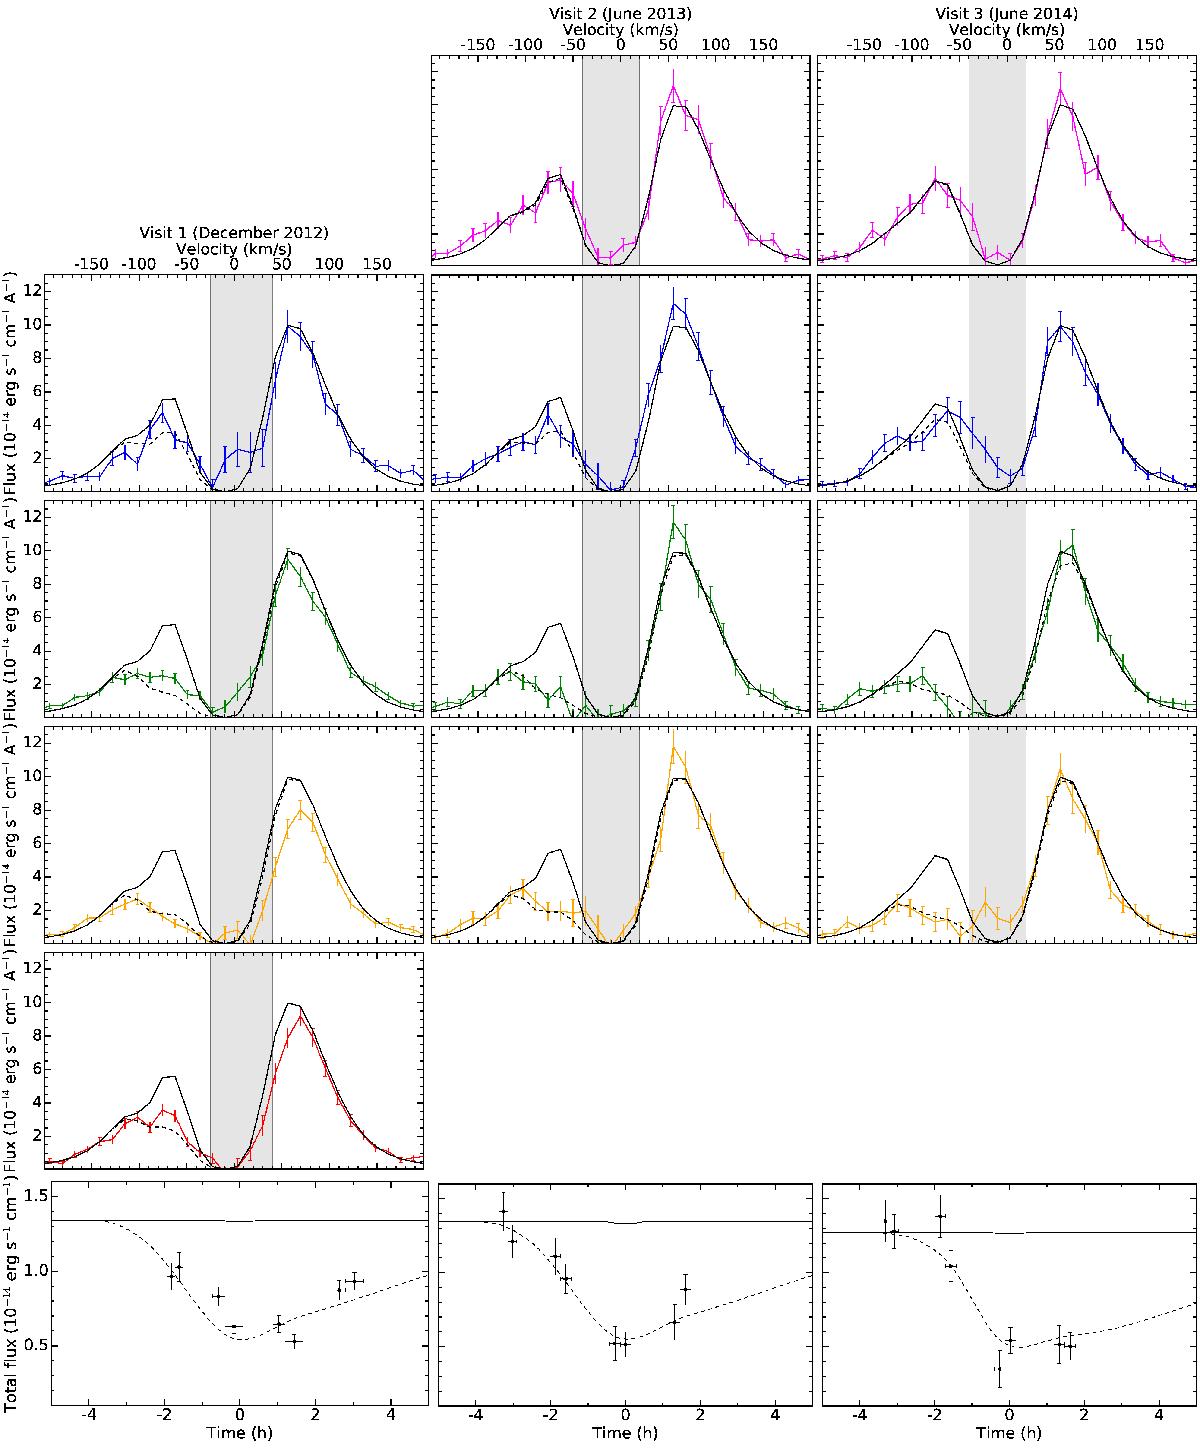
GJ 436 spectra during Visits 1 (left column), 2 (central column), and 3 (right column). Spectra in the same row were measured at about the same phase of the planet orbital position. We show the spectra gathered over the full HST orbits. The shaded gray area corresponds to the range affected by ISM absorption and geocoronal emission, which was excluded from the fits. Black solid spectra are the reconstructed out-of-transit stellar line profiles. Dashed black spectra correspond to the best-fit theoretical spectra for Visits 2 (reported for comparison in Visit 1 epoch) and 3. Note that the transit of the exosphere has little effect on the red wing, where the best fits nearly overlap with the out-of-transit spectra. In the bottom part of the plot, light curves for each epoch show the observed and theoretical flux integrated between − 120 and − 40 km s-1. The solid black line shows the optical transit.
Current usage metrics show cumulative count of Article Views (full-text article views including HTML views, PDF and ePub downloads, according to the available data) and Abstracts Views on Vision4Press platform.
Data correspond to usage on the plateform after 2015. The current usage metrics is available 48-96 hours after online publication and is updated daily on week days.
Initial download of the metrics may take a while.