Free Access
Fig. 6
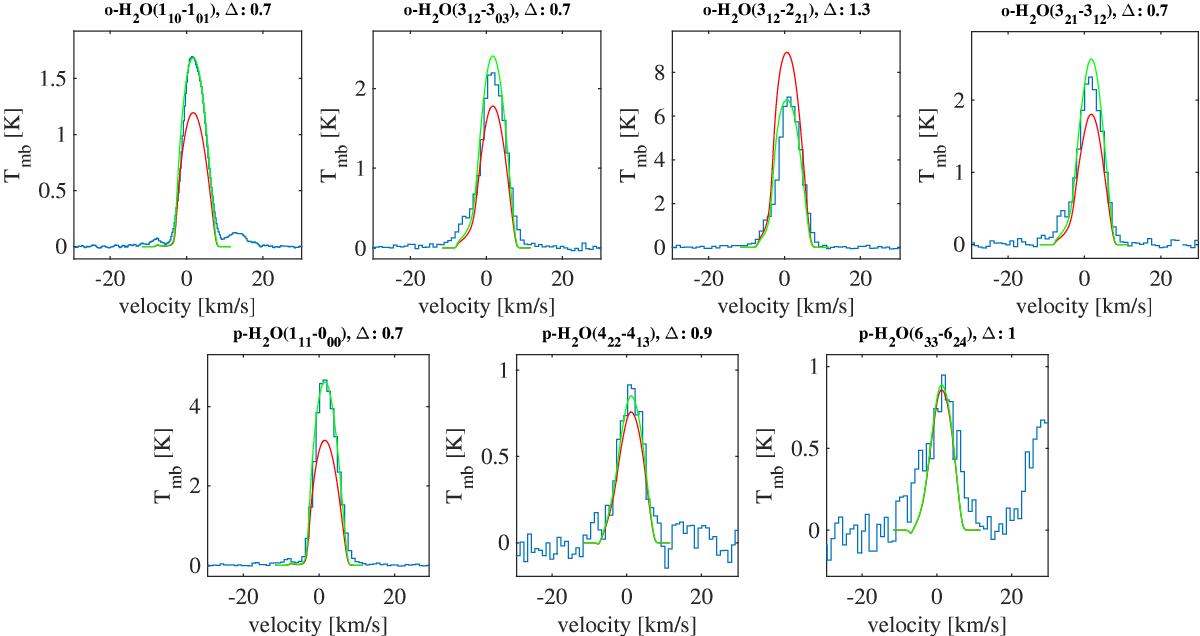
Best-fit o-H2O and p-H2O models of the HIFI lines for R Dor. The blue histograms are the observations. The red lines are the model lines, the green lines are the model lines scaled to the same integrated intensities as the observations. The velocities are given with respect to the νLSR = 6.5 km s-1.
This figure is made of several images, please see below:
Current usage metrics show cumulative count of Article Views (full-text article views including HTML views, PDF and ePub downloads, according to the available data) and Abstracts Views on Vision4Press platform.
Data correspond to usage on the plateform after 2015. The current usage metrics is available 48-96 hours after online publication and is updated daily on week days.
Initial download of the metrics may take a while.