Fig. 5
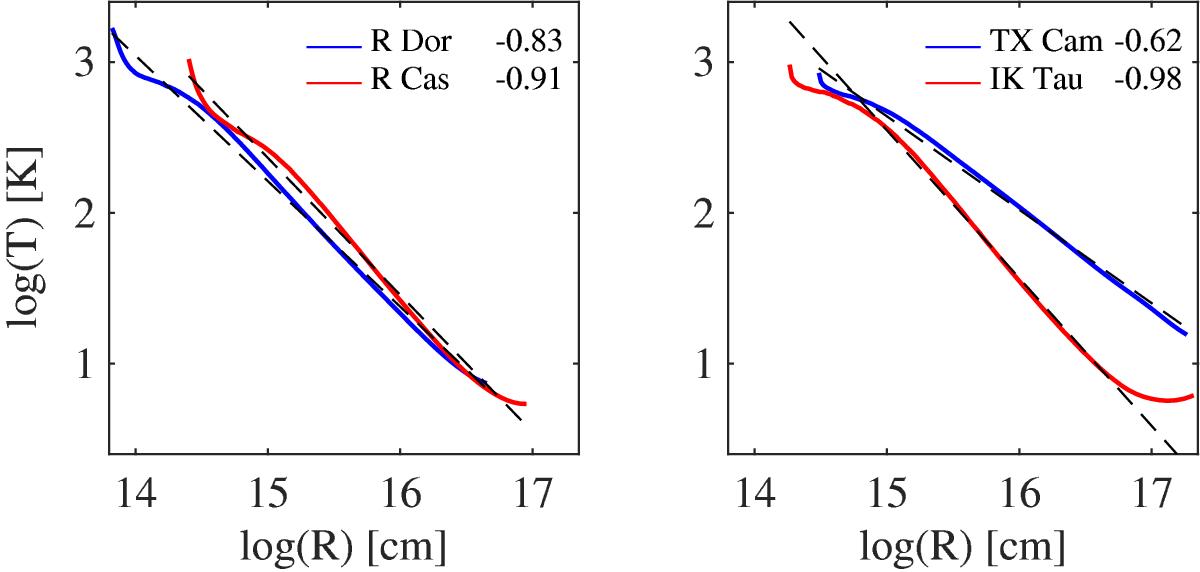
Kinetic temperature profiles (solid lines) calculated in the energy balance of the CO modelling for R Dor (left panel, blue), R Cas (left panel, red), TX Cam (right panel, blue), and IK Tau (right panel, red). The dashed lines show power-law fits to the individual profiles (Eq. (6)). The numbers give the exponents for the respective fits.
Current usage metrics show cumulative count of Article Views (full-text article views including HTML views, PDF and ePub downloads, according to the available data) and Abstracts Views on Vision4Press platform.
Data correspond to usage on the plateform after 2015. The current usage metrics is available 48-96 hours after online publication and is updated daily on week days.
Initial download of the metrics may take a while.