Fig. 4
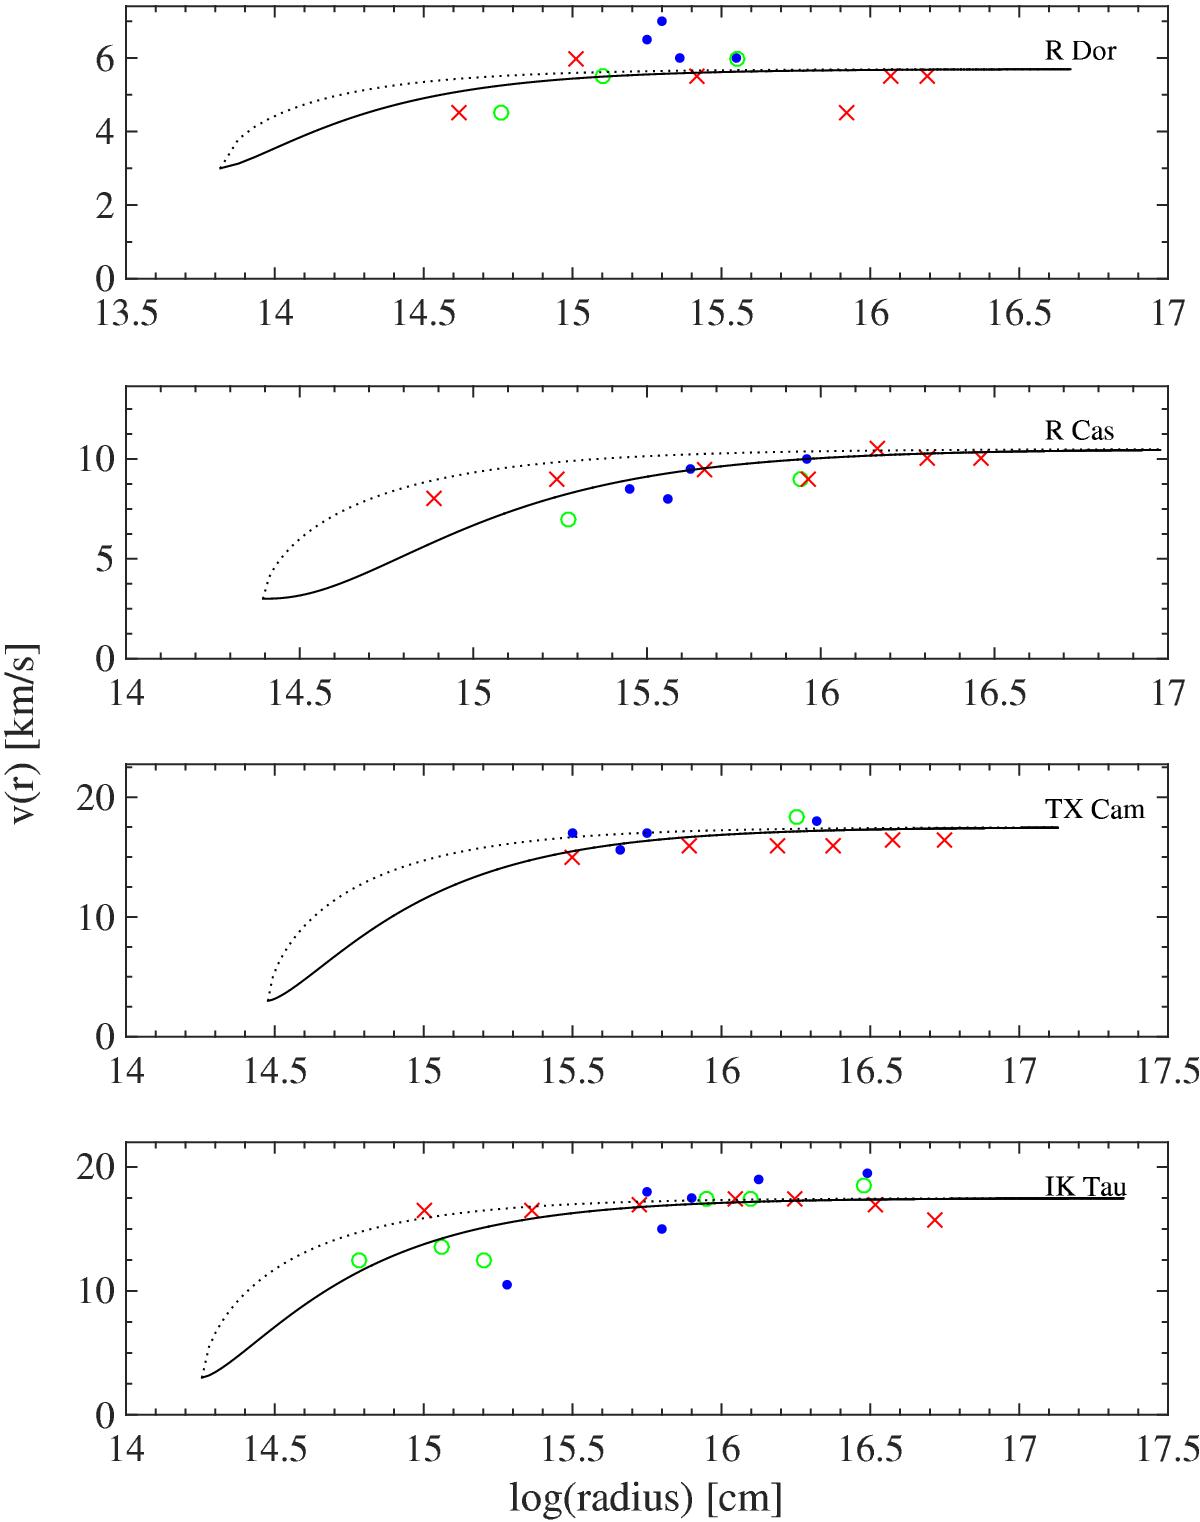
Velocity profiles derived for R Dor, R Cas, TX Cam and IK Tau (top to bottom) compared to the measured line-widths from lines emitted at different radii in the CSE (CO: red crosses, ortho-H2O: blue dots, para-H2O: green circles. The widths are measured at zero power. The radii are determined by the peak in the brightness profiles of each transition). The solid black lines give the profiles with the β given in Table 1, the dotted black lines give the profile for β = 0.6.
Current usage metrics show cumulative count of Article Views (full-text article views including HTML views, PDF and ePub downloads, according to the available data) and Abstracts Views on Vision4Press platform.
Data correspond to usage on the plateform after 2015. The current usage metrics is available 48-96 hours after online publication and is updated daily on week days.
Initial download of the metrics may take a while.