Fig. 7
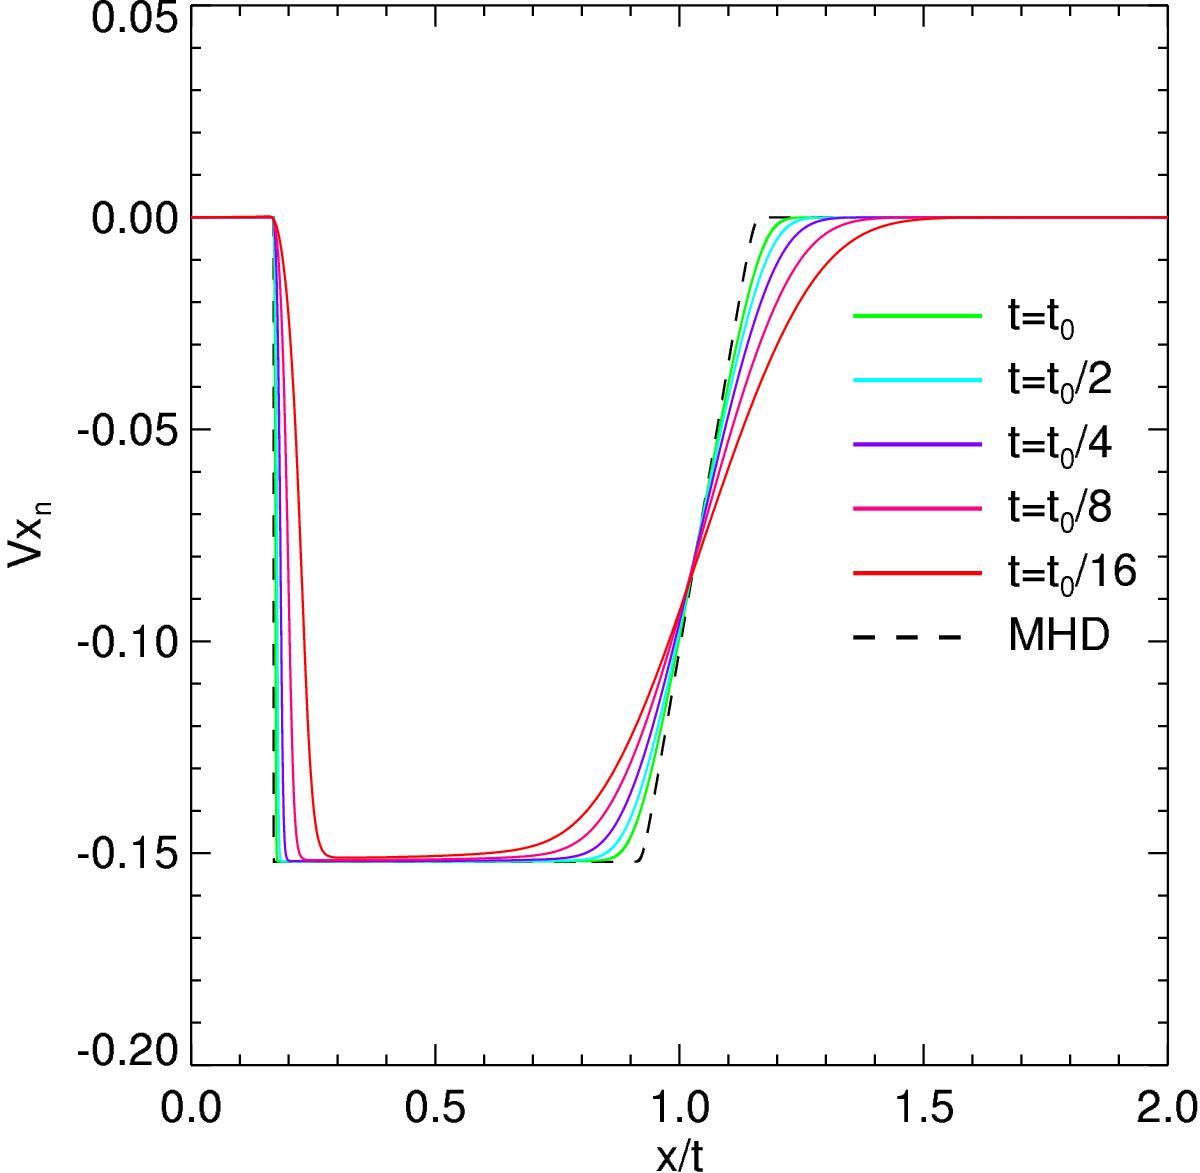
Quasi-self-similar evolution of the shock-rarefaction wave system. To highlight how the system is tending towards self-similarity, the x-axis is normalised by the time t of the snapshot of the simulation, therefore shows the velocity at which the waves are propagating in normalised units. As the time is increased, the system tends towards a self-similar state. The reference time is taken at t0 = 156 000τ and the distributions for t0, t0/ 2, t0/ 4, t0/ 8, and t0/ 16 are plotted. The reference ideal MHD solution is indicated by the black dashed line.
Current usage metrics show cumulative count of Article Views (full-text article views including HTML views, PDF and ePub downloads, according to the available data) and Abstracts Views on Vision4Press platform.
Data correspond to usage on the plateform after 2015. The current usage metrics is available 48-96 hours after online publication and is updated daily on week days.
Initial download of the metrics may take a while.