Fig. 2
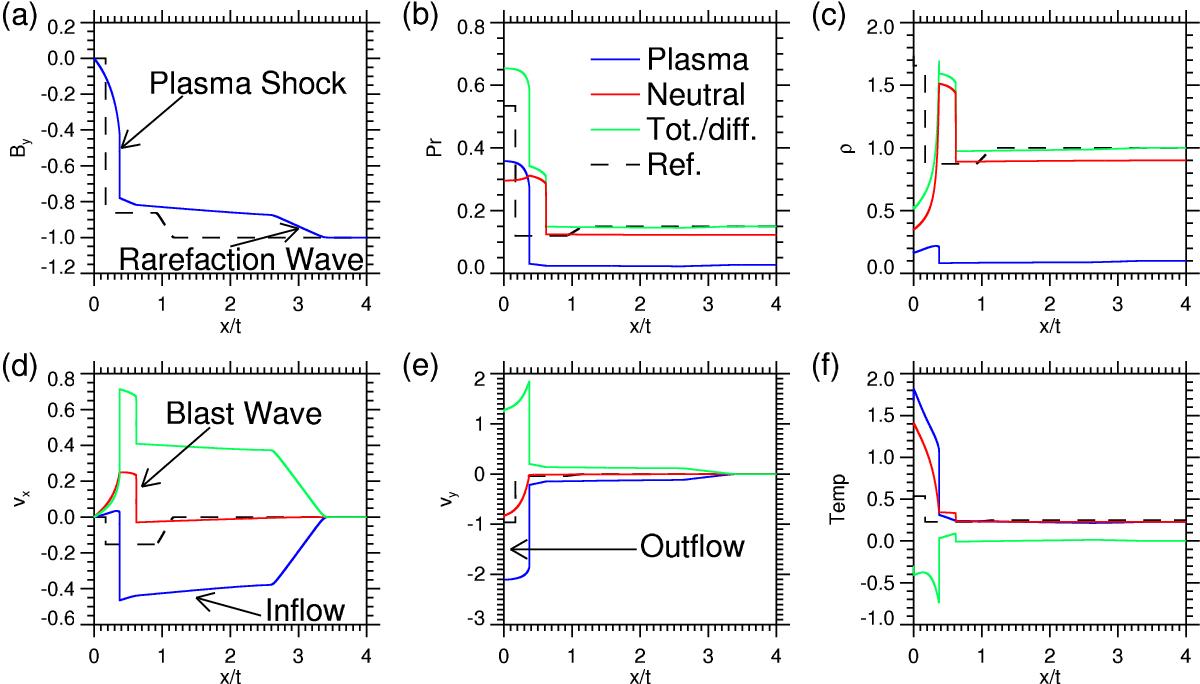
Spatial distribution in the x direction of Bya); gas pressure b); density c); vxd); vye); and temperature f) for the neutral (red) and ionised (blue) fluids at time t = 1τ. The green line indicates the total (pressure and density) or the difference (x and y velocities and temperature) for the two fluids. The dashed black line shows the reference MHD solution. The ionised plasma has taken on characteristics that are similar to the ideal MHD solution (but with faster wave speeds); the neutrals, however, are undergoing a violent expansion similar to that of a 1D point explosion.
Current usage metrics show cumulative count of Article Views (full-text article views including HTML views, PDF and ePub downloads, according to the available data) and Abstracts Views on Vision4Press platform.
Data correspond to usage on the plateform after 2015. The current usage metrics is available 48-96 hours after online publication and is updated daily on week days.
Initial download of the metrics may take a while.