Fig. 16
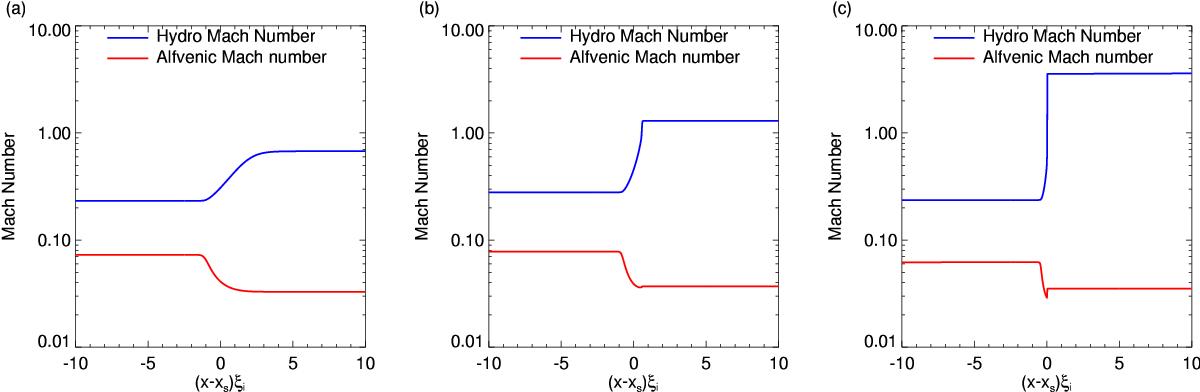
Spatial distribution of | vxn/Csn | and | vxp/VA | for a c-shock (β = 0.3 and ξi = 0.01) in panel a), a weak j-shock (β = 0.1 and ξi = 0.01) in panel b), and a j-shock (β = 0.01 and ξi = 0.01) in panel c) around the shock front (calculated in the shock frame). The x-axis is shifted by xs, where xs is taken as the point in the shock where the drift velocity is at its peak, so that all distributions are aligned.
Current usage metrics show cumulative count of Article Views (full-text article views including HTML views, PDF and ePub downloads, according to the available data) and Abstracts Views on Vision4Press platform.
Data correspond to usage on the plateform after 2015. The current usage metrics is available 48-96 hours after online publication and is updated daily on week days.
Initial download of the metrics may take a while.