Fig. 13
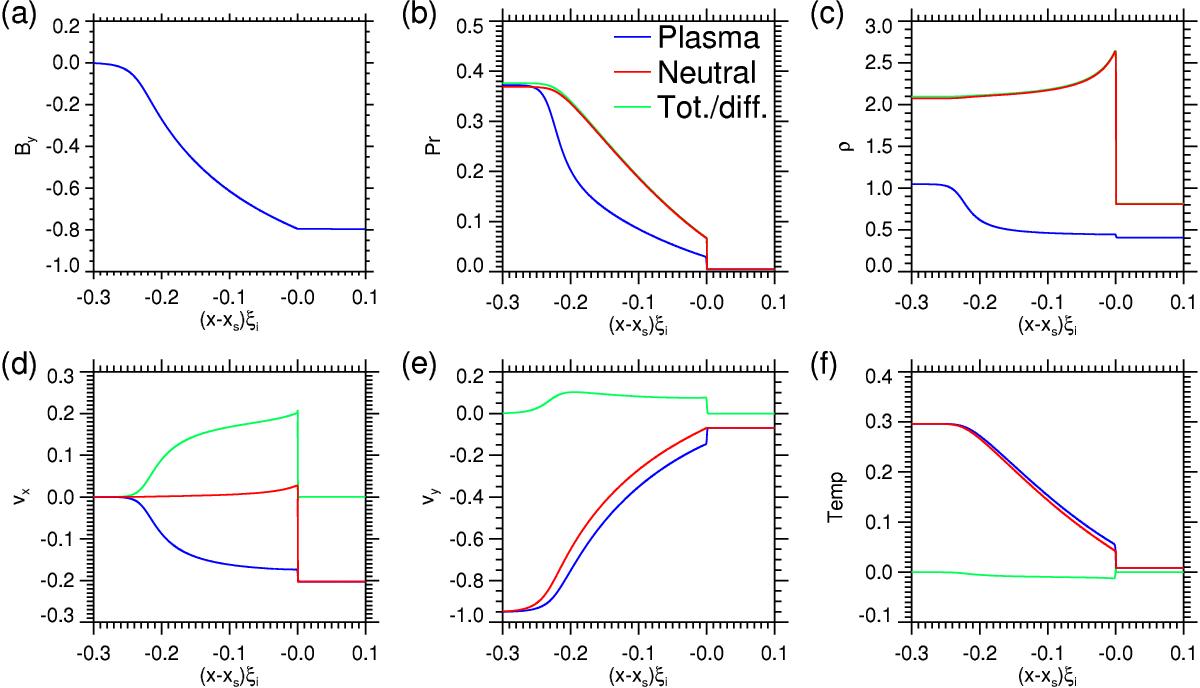
Spatial distribution in the x direction around the shock front and the coupling region of a) By; b) gas pressure; c) density; d)vx; e) vy; and f) the temperature for the neutral (red) and ionised (blue) fluids at time t = 15 000τ where β = 0.01 and ξi = 0.01. The green line indicates the total (pressure and density) or the difference (x and y velocities and temperature) for the two fluids. The plasma pressure and density are increased by a factor of 50 to make their distributions clearly visible. The x-axis has been shifted to set the origin at the shock front.
Current usage metrics show cumulative count of Article Views (full-text article views including HTML views, PDF and ePub downloads, according to the available data) and Abstracts Views on Vision4Press platform.
Data correspond to usage on the plateform after 2015. The current usage metrics is available 48-96 hours after online publication and is updated daily on week days.
Initial download of the metrics may take a while.