Fig. 15
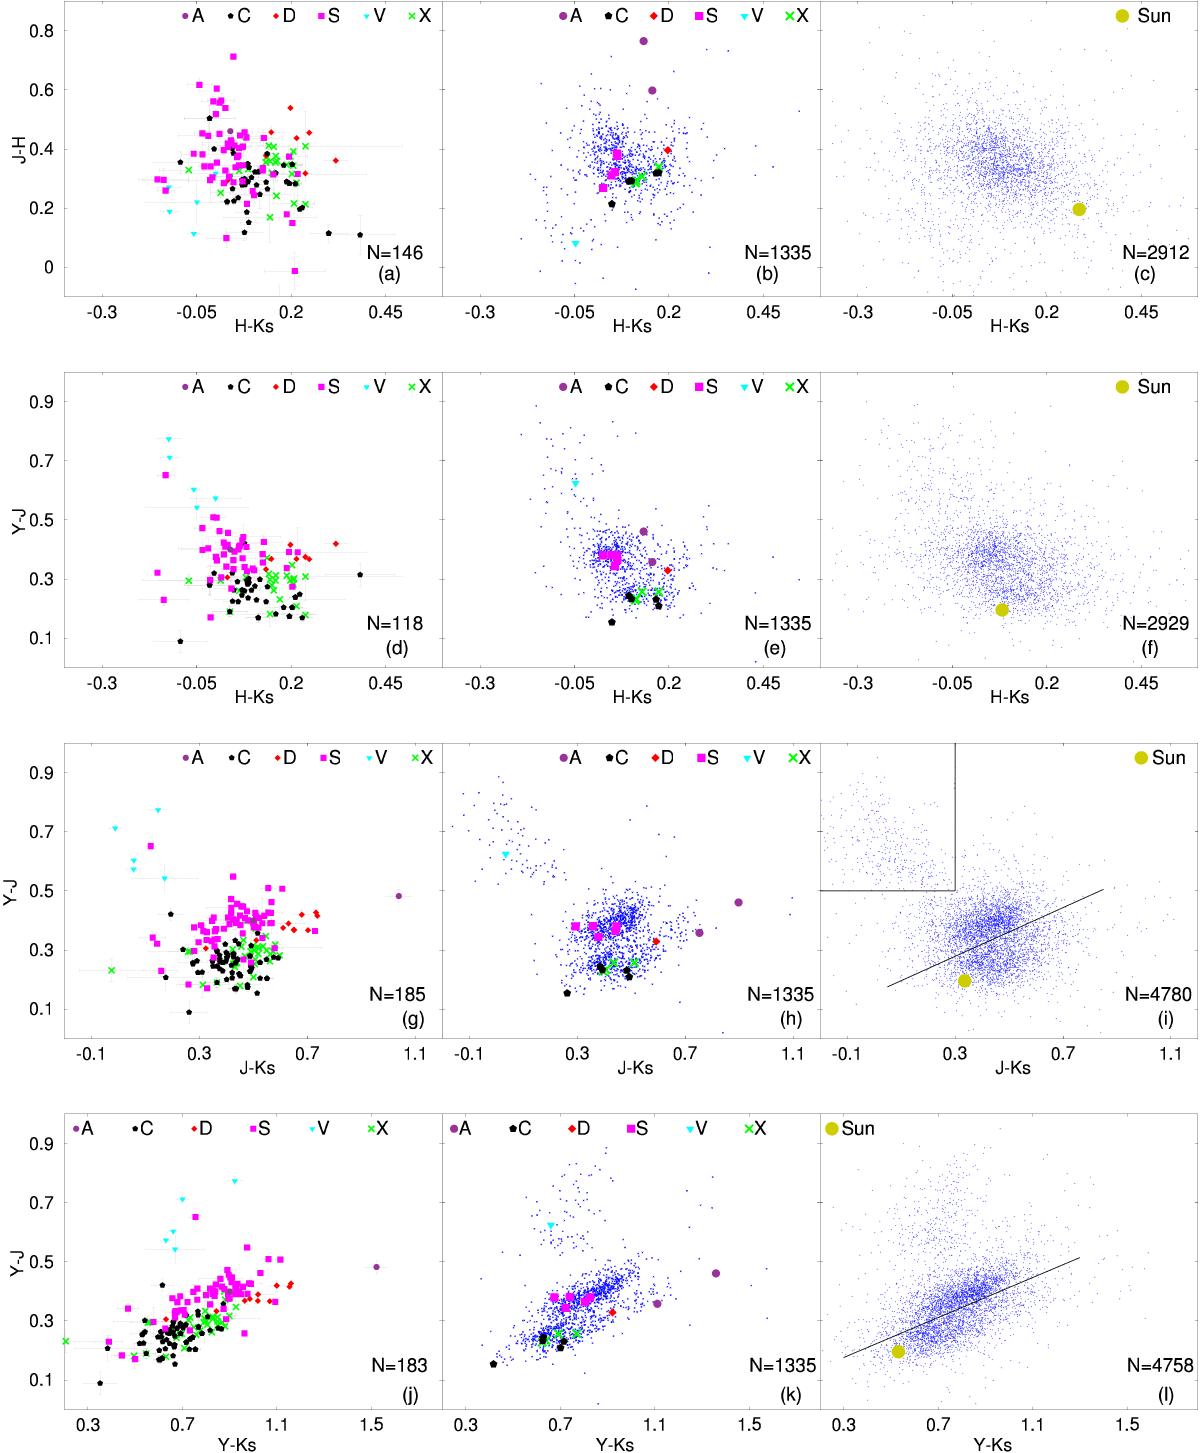
Color−color plots of the MOVIS-C data: (J − H) vs. (H − Ks) – in panels a), b), c); (Y − J) vs. (H − Ks) – in d), e), f); (Y − J) vs. (J − Ks) – g), h), i); (Y − J) vs. (Y − Ks) – j), k), l). Left column: the colors of asteroids with visible spectra, having an assigned taxonomic type. Central column: the colors computed for the template spectra of the taxonomic classes from DeMeo et al. (2009) compared with the MOVIS-C data with color errors less than 0.033 (C-complex includes B, C, Cb, Cg, Cgh, and Ch sub-classes and is denoted as C; S-complex includes Q, S, Sq, Sr, and Sv sub-classes and is denoted as S; X-complex includes X, Xc, Xe, and Xk sub-classes and is denoted as X; A class includes A and Sa types). Right column: the MOVIS-C data obtained with a color error less than 0.1 compared with the colors of the Sun (yellow dot).
Current usage metrics show cumulative count of Article Views (full-text article views including HTML views, PDF and ePub downloads, according to the available data) and Abstracts Views on Vision4Press platform.
Data correspond to usage on the plateform after 2015. The current usage metrics is available 48-96 hours after online publication and is updated daily on week days.
Initial download of the metrics may take a while.