Free Access
Fig. 5
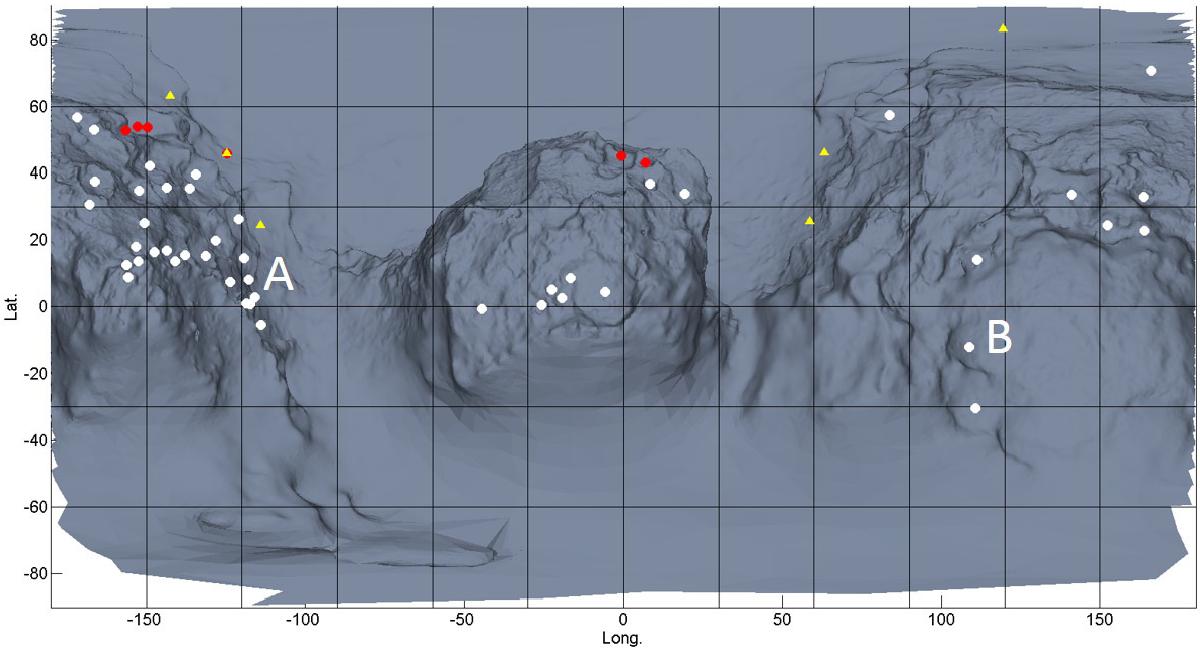
Distribution of the circular depressions on a Mercator projection map. The circles filled in red are the active pits in Vincent et al. (2015a). The triangles filled in yellow are the half pits near Hapi.
Current usage metrics show cumulative count of Article Views (full-text article views including HTML views, PDF and ePub downloads, according to the available data) and Abstracts Views on Vision4Press platform.
Data correspond to usage on the plateform after 2015. The current usage metrics is available 48-96 hours after online publication and is updated daily on week days.
Initial download of the metrics may take a while.